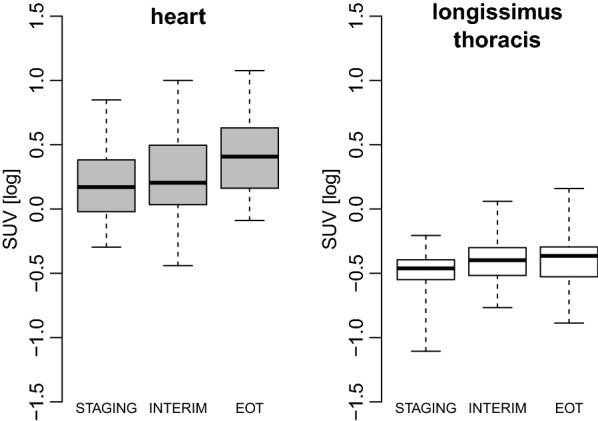
Fig. 2.

18FDG uptake during doxorubicin treatment in the myocardium and in the longissimus thoracis muscle. Boxes are median and interquartile ranges of left ventricular and skeletal muscle 18FDG standardized uptake values (SUV) at the indicated 18FDG positron emission tomography (18FDG-PET) scans. Vertical bars indicate the highest and lowest SUV at each time point. Repeated measures ANOVA P for trend = 0.0007 and 0.02 for SUV in the heart and longissimus thoracis, respectively. STAGING: 18FDG-PET before treatment; INTERIM: 18FDG-PET after 2 cycles of doxorubicin; EOT: 18FDG-PET at the end of treatment
