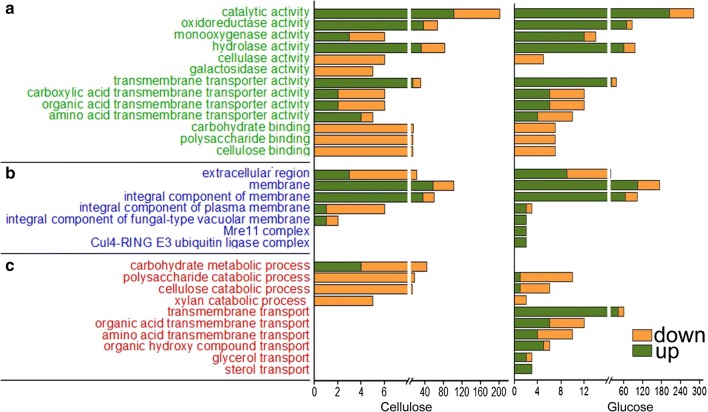
Fig. 6.
Gene ontology (GO) functional enrichment analysis of DEGs of strain ZC121 compared to the parental strain RUT-C30 grown on cellulose and glucose as the sole carbon source, respectively. The y axis represents the name of the most enriched GOs that belong to different ontologies: (a) the molecular function, (b) the cellular component and (c) the biological process, while the x axis represents the number of DEGs in each enriched GO

