Fig. 9.
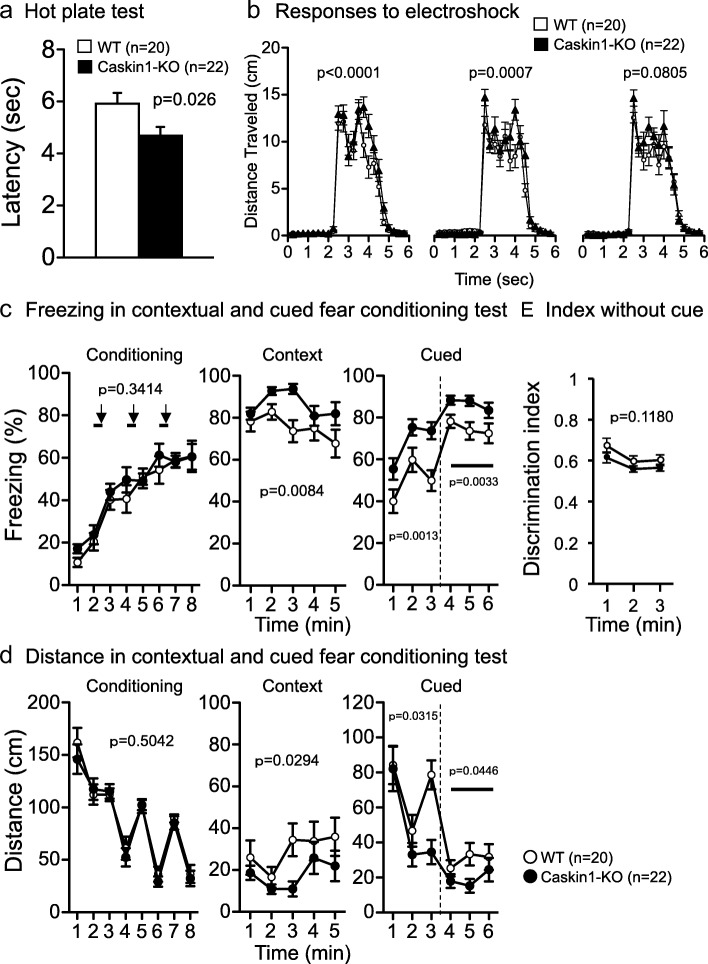
Sensitivities to noxious stimuli and contextual and cued-fear conditioning test 1 day after conditioning in wild-type and Caskin1-KO mice. a Latency to paw lick or foot shake (sec) on a 55 °C hot plate in the hot-plate test. (b-d) Context and cued-fear conditioning test. In A and B, p-values indicate genotype effect in one-way ANOVA. In B, level of significance was set at α = 0.05/3 by post hoc Bonferroni’s multiple-comparison test. b Distance traveled (cm) in 6 s with electrical stimulation (2 s) for conditioning. c Freezing responses on the conditioning day (left), in the contextual test 1 day after conditioning (middle), and in the cue test 1 day after conditioning (right). d Total distance on the conditioning day (left), in the contextual test 1 day after conditioning (middle), and in the cue test at 1 day after conditioning (right). Bold lines and arrows represent tone and footshock, respectively. e Discrimination index was calculated using the following formula: (a)/(a + b), where “a” equals freezing (%) at 1–3 min in the context test and “b” equals freezing (%) at 1–3 min in the cued test with altered context. In C–E, the p-values indicate genotype effect in two-way repeated measures ANOVA. All values are presented as means ± SEM

