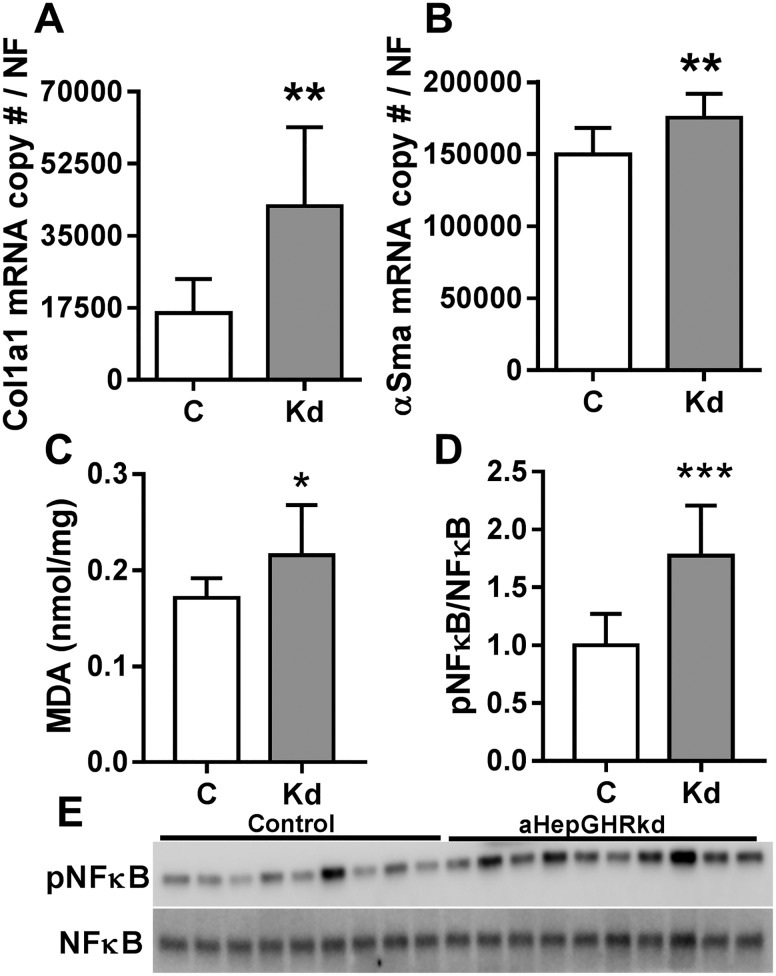
Figure 2.
aHepGHRkd mice (27 wk after AAV8 treatment) show early signs of fibrosis and oxidative stress. Hepatic (A) Col1a1 and (B) αSma expression. Hepatic (C) MDA levels and (D) ratio of phosphorylated NF-κB/NF-κB. (E) Western blot of phosphorylated NF-κB/NF-κB. Open columns indicate control mice (C); filled columns indicate aHepGHRkd mice (Kd). Data are represented as means ± SEM. Gene expression is shown as mRNA copy number divided by a normalization factor (NF) calculated from the expression levels of three housekeeping genes, Ppia, β-actin, and Hprt. n = 9 to 10 mice per group. Asterisks indicate significant difference between control and aHepGHRkd mice within age group: *P < 0.05; **P < 0.01; ***P < 0.001.

