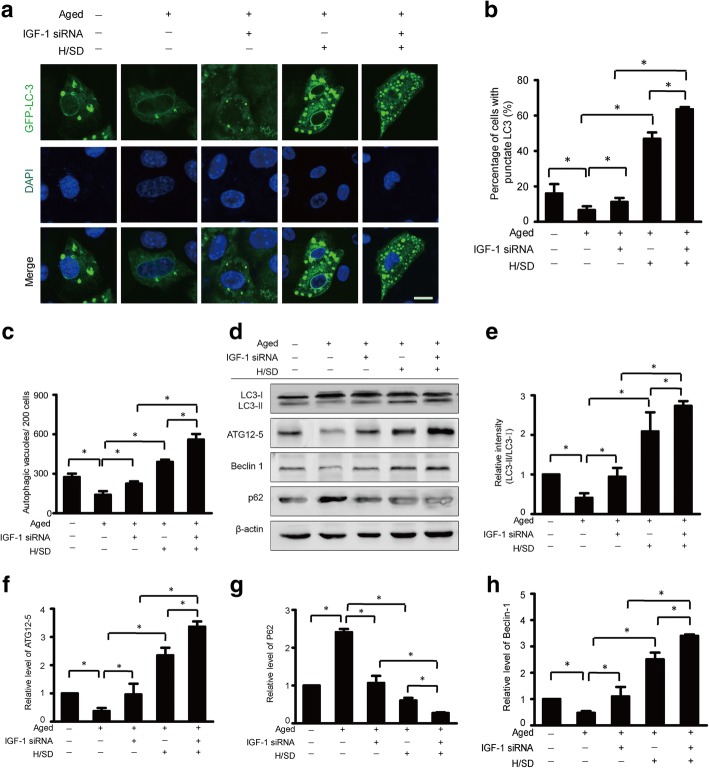
Fig. 7.
IGF-1 knockdown increased autophagy. a Representative immunofluorescence images of GFP-LC3 (green fluorescent) and DAPI (blue fluorescence) in the BM-MSCs of each group. b Quantification of autophagy is shown as the percentage of BM-MSCs with LC3 (n = 5, *p < 0.05). c Quantification of the average number of autophagic structures in the cytoplasm d Representative western blots of LC3-I/LC3-II, ATG12-5, Beclin-1, and P62in BM-MSCs subjected to H/SD with or without IGF-1 siRNA administration. Semiquantification of the protein expression levels of LC3-II (e), ATG12–5 (f), p62 (h), and Beclin-1(g) at the indicated time point (n = 5, *p < 0.05)

