
Figure 4.
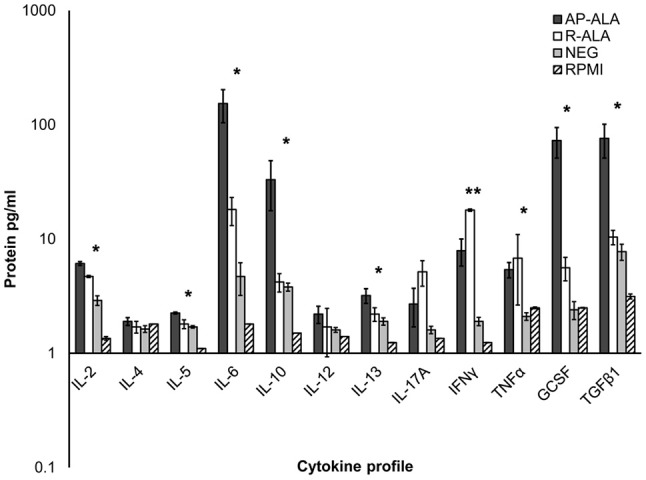
Cytokine profile on PBMC cells stimulated with rEhCRT. The data shows the concentration of cytokines, obtained in the supernatant of PBMC cells of different studied groups (NEG, AP-ALA, and R-ALA) after 72 h of incubation and stimulated with rEhCRT or without stimulus (RPMI). The concentration of interleukins is expressed as pg/ml in a logarithmic scale. *p ≤ 0.005, when compared groups of individuals (NEG) against the group of patients (ALA), **when compared AP-ALA against R-ALA groups.