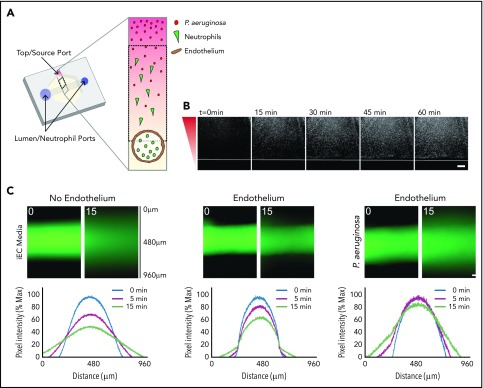
Figure 1.
Characterization of in vitro infection model through an endothelial lumen. (A) Schematic of the endothelial lumen infection model shows neutrophils (green) leaving the endothelial lumen and migrating to a source of bacteria (red). Cross-sectional area indicated by the gray box. Black dotted box indicates imaging area. (B) PAK strains expressing mCherry move through the system and reach the lumen by 1 hour. White line indicates the edge of the lumen. Bacterial gradient direction shown in red. (C) FITC-dextran diffusion from lumens at 0 and 15 minutes. Pixel intensity measured across the images and normalized to the intensity of the lumen center at t = 0 minutes. Scale bar, 100 µm for B-C.

