. 2018 Oct 2;9(41):7916–7930. doi: 10.1039/c8sc04041a

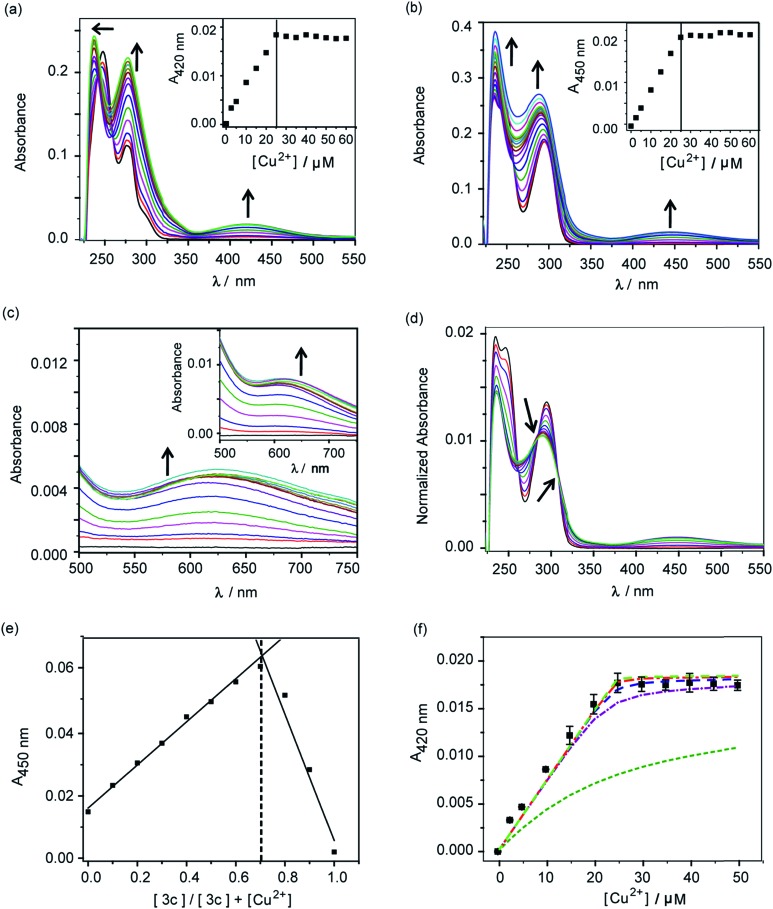
Fig. 2. Absorbance response of ligands 2c and 3c with Cu2+. (a) Ultraviolet (UV)-visible titration of 2c (50 μM) with CuCl2 (0–60 μM) in buffer. Black arrows indicate spectral changes upon addition of Cu2+. The inset shows the plot of absorbance at 420 nm versus concentration of Cu2+. (b) UV-visible titration of 3c (50 μM) with CuCl2 (0–60 μM) in buffer. Black arrows indicate spectral changes upon addition of Cu2+. The inset shows the plot of absorbance at 450 nm versus concentration of Cu2+. (c) Visible-near infra-red (NIR) absorbance spectra for titration of 2c with Cu2+. The inset shows visible-NIR absorbance spectra for titration of 3c with Cu2+. (d) Area normalized absorbance spectra representing titration of CuCl2 to 3c. Black arrows indicate isosbestic points. (e) Job's plot depicting absorbance versus mole fraction for the Cu2+3c system. (f) Absorption binding plot for titration of Cu2+ to 2c (50 μM, black squares) with simulated fits (fitted to equation: conditional stability constant β = [ML2]/[M][L]2), using log β as 9 (green dashed line), 11 (purple dashed line), 12 (blue dashed line), 13 (red dashed line), 14 (light green dashed line). Buffer used 20 mM HEPES (100 mM NaCl, pH 7.0).

Fig. 2