. 2018 Oct 2;9(41):7916–7930. doi: 10.1039/c8sc04041a

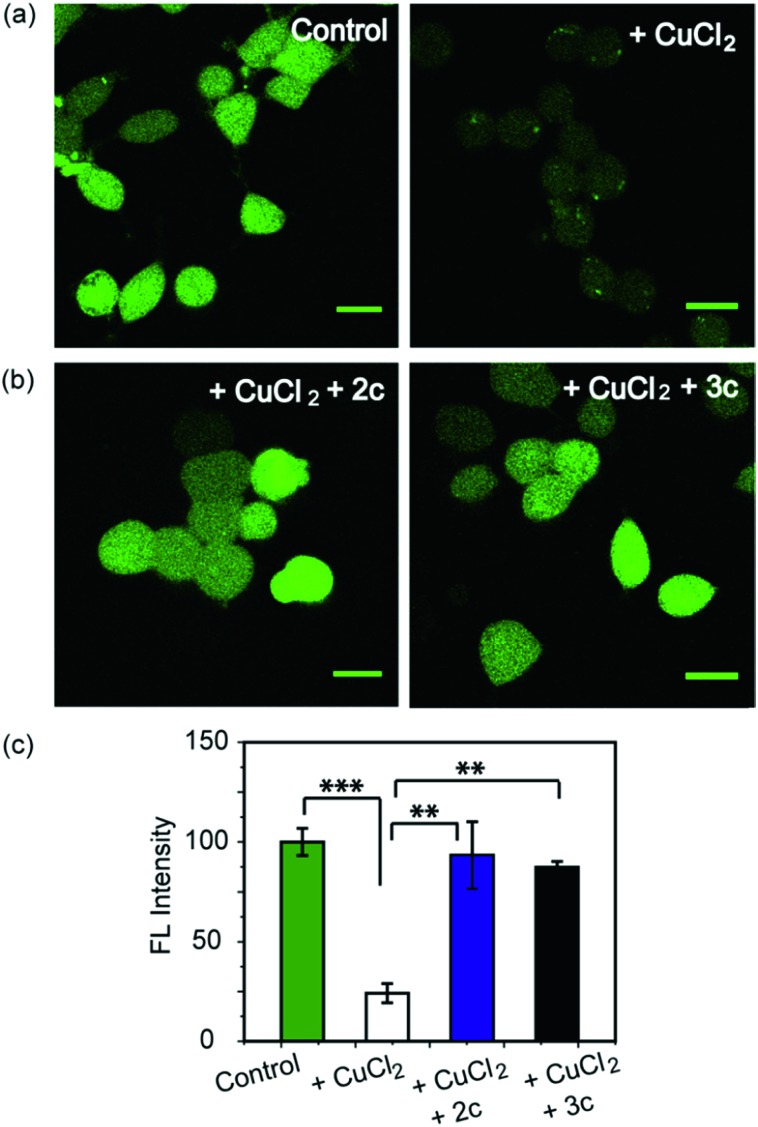
Fig. 5. Confocal fluorescence images of live HEK293T cells to show the effect of Cu2+ chelators using a Cu ion responsive dye Phen Green FL. All cells were incubated with Phen Green FL dye (5 μM) initially for 30 min before any further treatments. (a) Left to right: control cells; cells treated with CuCl2 (20 μM) for 30 min. (b) Left to right: cells treated with CuCl2 (20 μM) for 30 min followed by 2c (80 μM) for 30 min; CuCl2 (20 μM) for 30 min followed by 3c (80 μM) for 30 min. Cells were washed three times with PBS buffer after each addition and then imaged (λex/em: 488/498–600 nm). Fluorescence intensity analyses of confocal images were carried out by using ImageJ software. (c) Bar plots represent the intensity analyses results. Intensity data were normalized to intensity of control untreated cells. Error bars denote SEM, n = 3. Statistical analyses were performed using an unpaired, two-tailed Student's t-test (**p ≤ 0.01, ***p ≤ 0.001). Images were acquired using a 40× objective; scale bar: 20 μm.

Fig. 5