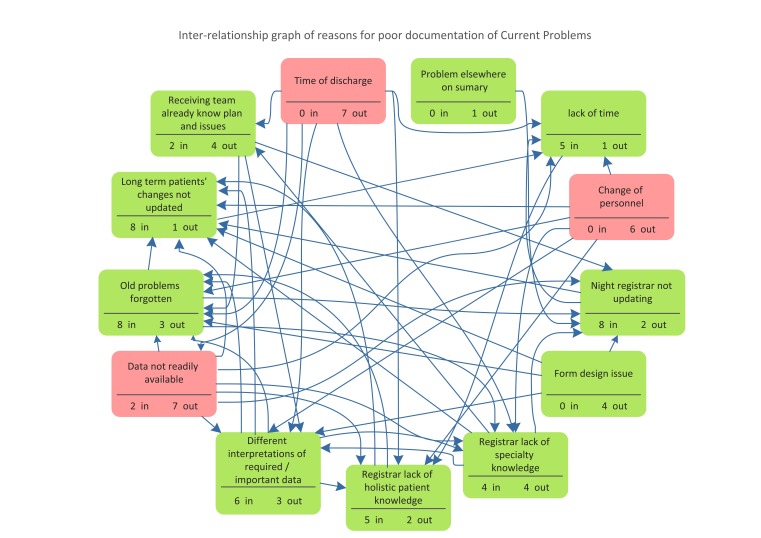
Figure 1.
An inter-relationship graph. The possible causes of poor documentation of current problems (CP) are examined in pairs to determine if a cause and effect relationship occurs between each pair. The arrows represent the direction from cause to effect. The total number of arrows away from an item represents that item’s contribution as a cause of the problem. The total number of arrows towards an item represents that item’s contribution as an effect. The three highlighted items are those items with the most arrows leading away, so are the main causes of poor documentation of CPs.

