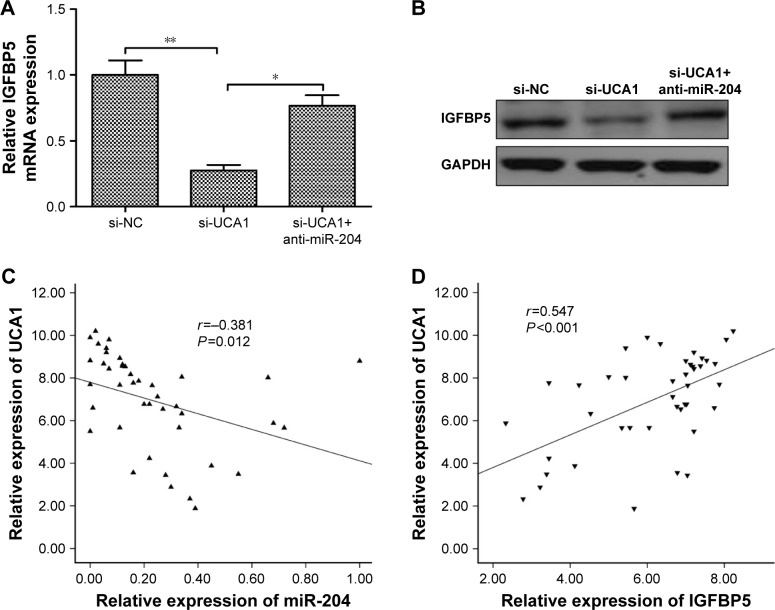
Figure 4.
UCA1 regulated IGFBP5 expression through miR-204.
Notes: (A) IGFBP5 mRNA expression was measured in TPC-1 cells transfected with si-NC or si-UCA1 and with/without anti-miR-204 by qRT-PCR. GAPDH was used as an internal control. (B) IGFBP5 protein expression was determined in TPC-1 cells transfected with si-NC or si-UCA1 and with/without anti-miR-204 by Western blot. GAPDH was used as an internal control. (C) UCA1 expression levels were inversely correlated with the miR-204 level in 42 PTC samples using Pearson’s correlation analysis. (D) UCA1 expression levels were positively correlated with the IGFBP5 level in 42 PTC samples using Pearson’s correlation analysis. All data are representative of three independent experiments and expressed as mean±SD. *P<0.05 and **P<0.01.
Abbreviations: NC, negative control; qRT-PCR, quantitative reverse transcription-PCR; PTC, papillary thyroid carcinoma.

