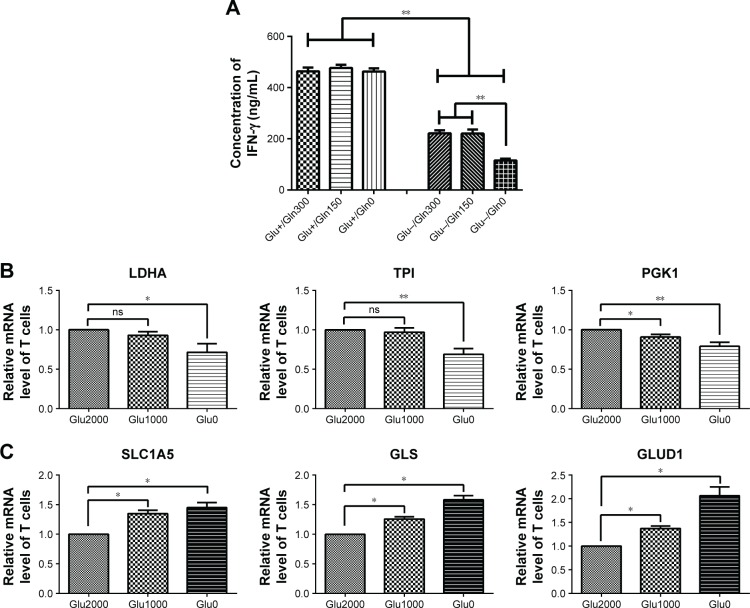
Figure 2.
IFN-γ production and metabolism-associated gene expression in glycolysis and glutaminolysis in T cells under glucose-deprived conditions.
Notes: (A) IFN-γ production of T cells was investigated by performing an ELISA. (B, C) Expression of glycolysis- (LDHA, TPI, and PGK1) and glutaminolysis-related genes (SLC1A5, GLS, and GLUD1) in T cells cultured with media containing different glucose concentrations (Glu2000, glucose 2,000 mg/L; Glu1000, glucose 1,000 mg/L; Glu0, glucose 0 mg/L; Gln300, glutamine 300 mg/L; Gln150, glutamine 150 mg/L; Gln0, glutamine 0 mg/L). *P<0.05, **P<0.01; ns, not significant.

