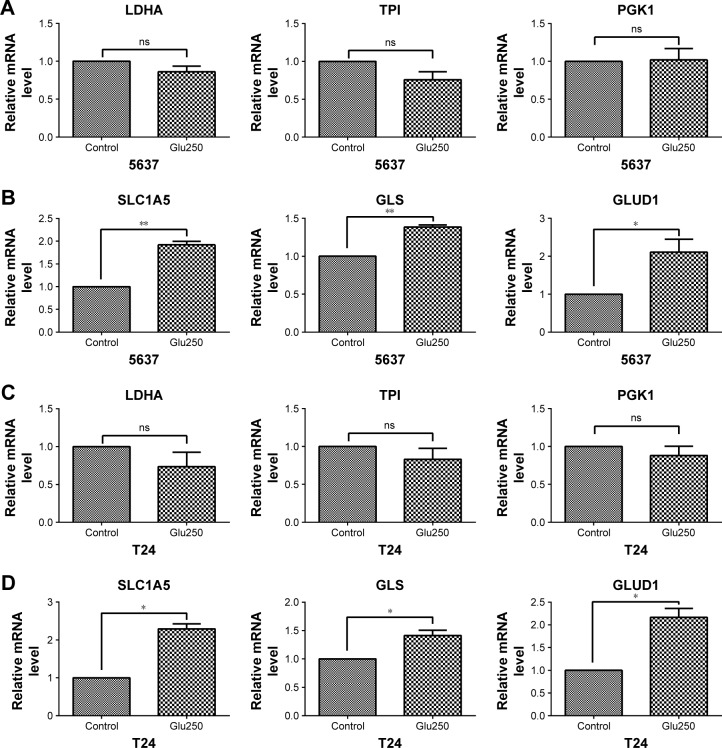
Figure 3.
Gene expression associated with glycolysis and glutaminolysis in 5637 and T24 cells under glucose-deprived conditions (Glu250, glucose 250 mg/L) for 24 hours.
Notes: (A, C) Glycolysis-associated gene expression (LDHA, TPI, and PGK1) in 5637 and T24 cells. (B, D) Glutaminolysis-associated gene expression (SLC1A5, GLS, and GLUD1) in 5637 and T24 cells. *P<0.05, **P<0.01; ns, not significant.

