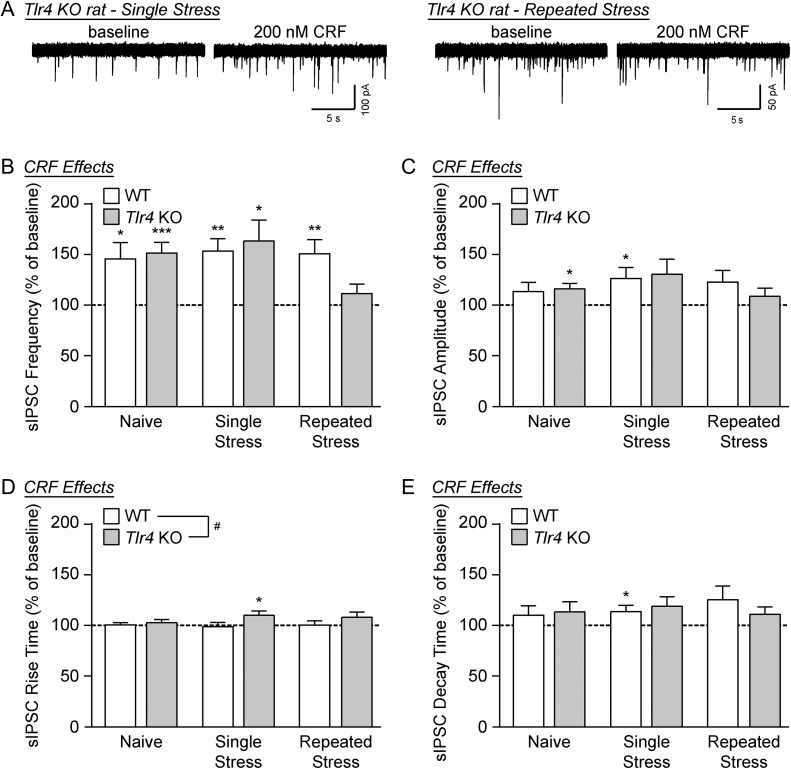
Figure 3.
CRF facilitation of GABA release is reduced in the CeA of Tlr4 KO rats following repeated restraint stress. (A) Representative sIPSC traces recorded in the CeA of Tlr4 KO rats that experienced either single or repeated restraint stress, at baseline and during CRF (200 nM) superfusion. (B) CRF significantly increased sIPSC frequencies in all restraint stress-treated animals by one-sample t-test (WT/single stress: t(11) = 4.40, **P < 0.01; KO/single stress: t(10) = 3.09; *P < 0.05; WT/repeated stress: t(14) = 3.70; **P < 0.01), except for the repeated stress Tlr4 KO rats (t(11) = 1.27, P = 0.23). Despite this difference, two-way ANOVA across both genotypes (WT and Tlr4 KO) and all three treatment groups (naïve, single stress and repeated stress) showed no significant main effects (genotype: F(1,70) = 0.47, P = 0.50; stress treatment: F(2,70) = 1.94, P = 0.15), and no significant interaction (F(2,70) = 1.94, P = 0.15). (C) The sIPSC amplitude was also increased by CRF in single stress WT rats (one-sample t-test, t(11) = 2.49, *P < 0.05), but two-way ANOVA revealed no significant main effects of genotype (F(1,70) = 0.08, P = 0.78) or stress treatment (F(2,70) = 1.01, P = 0.35), and no interaction (F(2,70) = 0.50, P = 0.61). (D) CRF increased the sIPSC rise time in single stress Tlr4 KO rats (one-sample t-test, t(10) = 2.38, *P < 0.05). In addition, by two-way ANOVA there was a significant main effect of genotype (F(1,70) = 4.59, #P < 0.05) on CRF-induced rise times, which was associated with no main stress treatment effect (F(2,70) = 0.29, P = 0.75) and no stress x genotype interaction (F(2,70) = 0.62, P = 0.54). (E) The sIPSC decay time was also increased by CRF in single stress WT rats (one-sample t-test, t(11) = 2.25, *P < 0.05), but two-way ANOVA revealed no significant main effects of genotype (F(1,70) = 0.05, P = 0.82) or stress treatment (F(2,70) = 0.22, P = 0.80), and no interaction (F(2,70) = 0.58, P = 0.56). For all data presented in this figure, the WT/single stress group comprised 12 cells from four rats, Tlr4 KO/single stress group of 11 cells from four rats, WT/repeated stress group of 15 cells from five rats, Tlr4 KO/repeated stress group of 12 cells from four rats, and the naïve data was taken from Fig. 1F–I. All data are presented as mean ± SEM.

