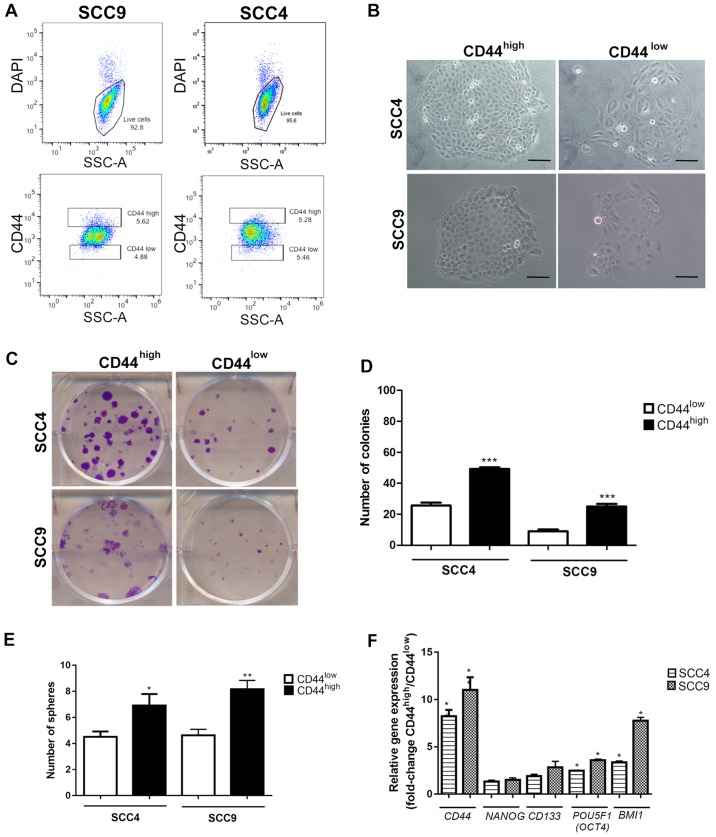
Figure 1.
Analysis of cancer stem cell (CSC) properties in SCC4 and SCC9 cell lines. (A) Representative images of the gates used to sort the CD44high and CD44low fractions. (B) Cell morphology of CD44high and CD44low fractions, demonstrating the presence of holoclones in CD44high cells. (C) Colony formation ability of CD44high and CD44low fractions. Graphs representing the (D) number of colonies and (E) number of spheres in CD44high and CD44low cells. (F) RT-qPCR for CD44, NANOG, CD133, POU5F1 (OCT4) and BMI1 transcripts. Fold change values represent the relative gene expression in CD44high cells in relation to CD44low cells. *P<0.05, **P<0.01 and ***P<0.001 (t-tests with the Welch correction). Data for SCC9 cells was gathered as previously described by de Andrade et al (51). Microscope images: Magnification, ×100 (scale bars, 40 μm).

