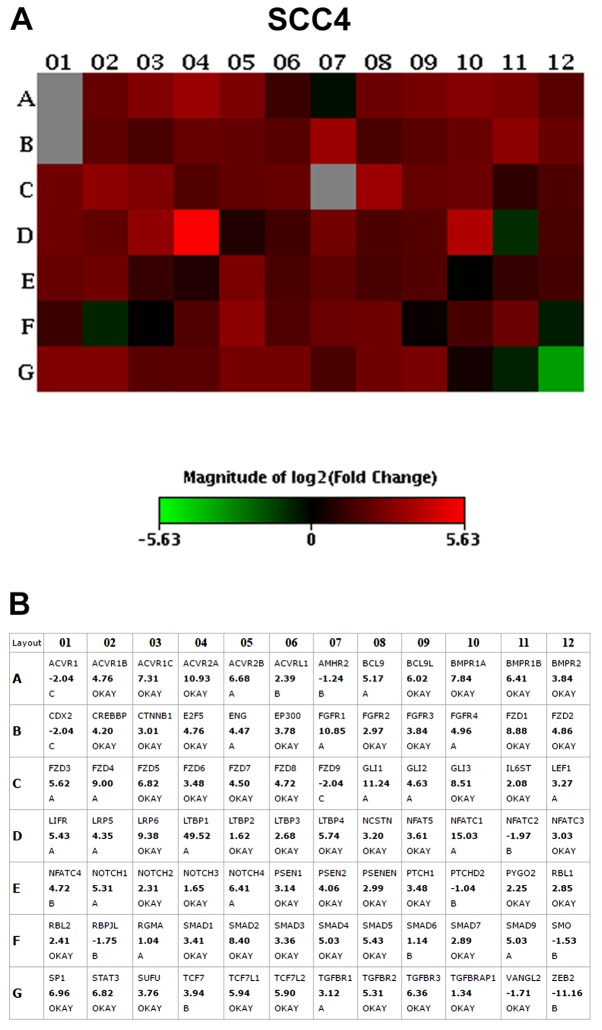
Figure 2.
(A) PCR array heatmap of the differentially expressed genes in SCC4 CD44high in relation to CD44low cells. (B) Fold change values for each gene evaluated. Only genes with a fold change >2.0 and classified as 'A' and 'OKAY' by the PCR array software were considered overexpressed. Data represents the fold change values of 3 independent experiments.

