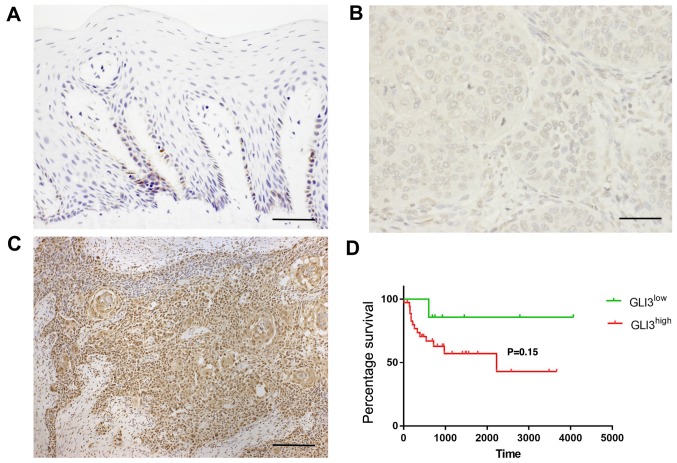
Figure 6.
GLI3 protein expression in non-tumour margin and in OSCC samples. (A) GLI3 expression was mainly observed in basal and suprabasal cells in the non-tumour margin. (B) GLI3low expression in OSCC. (C) GLI3high expression in OSCC, mainly in the tumour island, as well as in the invasive areas (magnification, ×100). (D) Overall survival rate in patients with a GLI3high expression when compared to those with a GLI3low expression in OSCC (P=0.15). Microscope images: (A and B) Magnification, ×400 (scale bar, 10 μm); (C) ×100 (scale bars, 40 μm).

