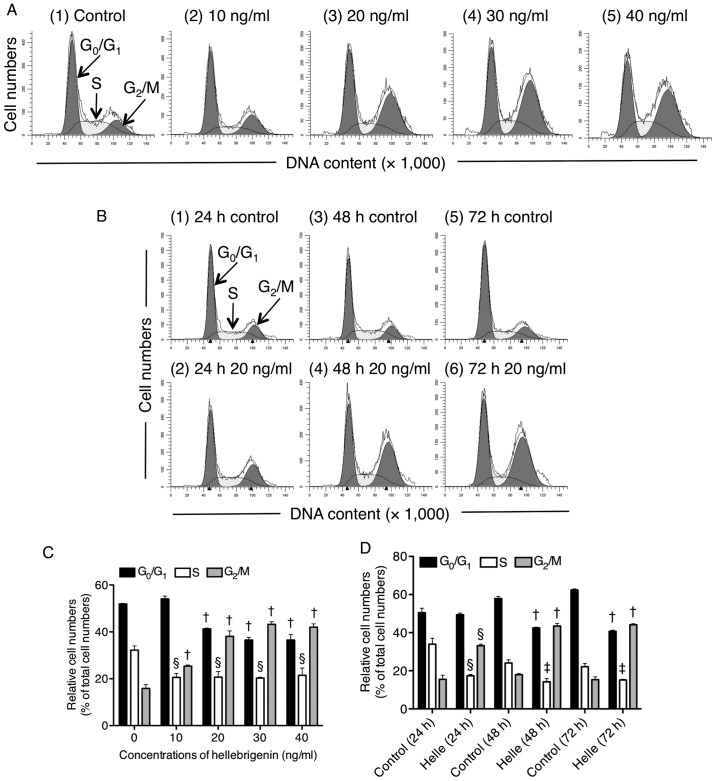
Figure 5.
Effect of Helle on the cell cycle profiling in U-87 cells. Following treatment with various concentrations of Helle (10, 20, 30 and 40 ng/ml) for 48 h (A), or 20 ng/ml Helle for 24, 48 and 72 h (B), cell cycle analysis was performed using a FACSCanto flow cytometer as described in Materials and methods. ModFit LT™ v3.0 was then used to calculate the number of cells in each G0/G1, S and G2/M phase fraction following treatment (C) with the indicated concentrations of Helle for 48 h, or (D) with 20 ng/ml Helle for the indicated time periods (D). A representative FACS histogram from three independent experiments is shown. Data are presented as the mean ± standard deviation from three independent experiments. ‡P<0.01, §P<0.001 and †P<0.0001 vs. respective control. Helle, hellebrigenin.

