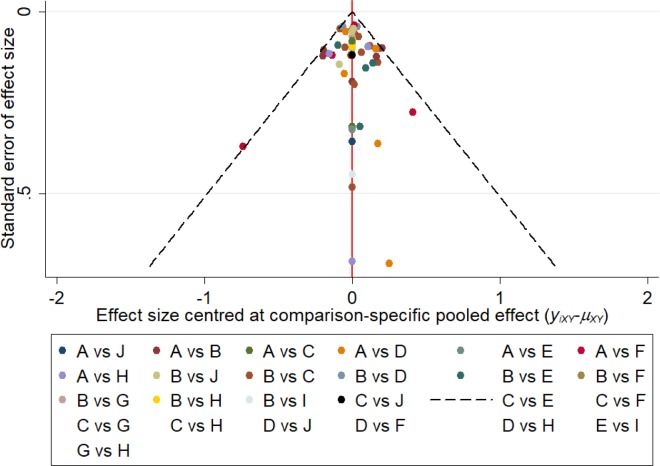
Figure 5.
Comparison-adjusted funnel plot for the network meta-analysis.
Notes: The red line suggests the null hypothesis that the study-specific effect sizes do not differ from the respective comparison-specific pooled effect estimates. Different colors represent different comparisons (A: placebo; B: fluconazole; C: clotrimazole; D: miconazole; E: itraconazole; F: ketoconazole; G: econazole; H: butoconazole; I: terbinafine; J: terconazole).

