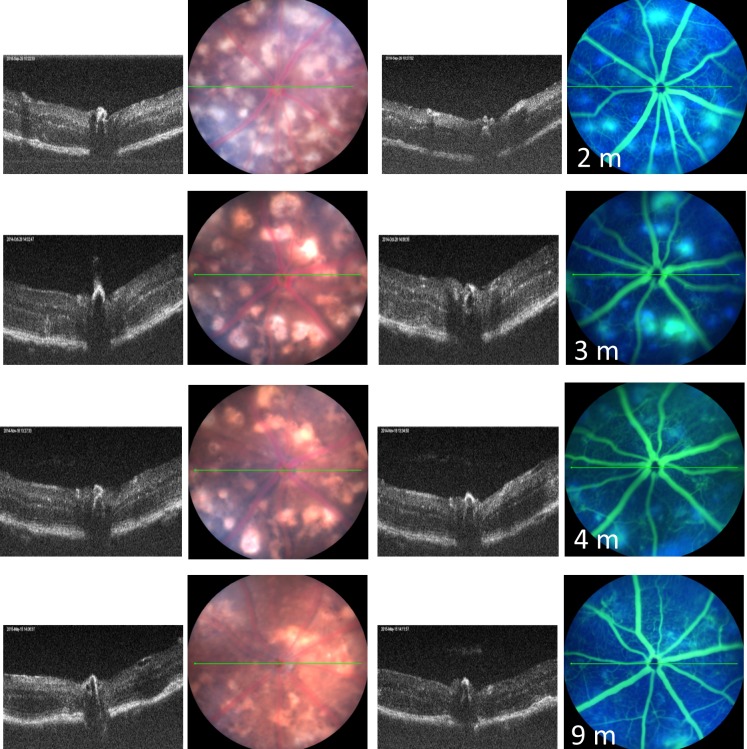
Figure 2.
Representive images of the clinical retinal phenotype of B6.Cg-Crb1rd8Jak3m1J/Boc mice from 2 to 9 months of age using optical coherence tomography and fluorescein angiography. The green lines are the plane in which the B-scan to the left of the fundus images were taken in the same animal.

