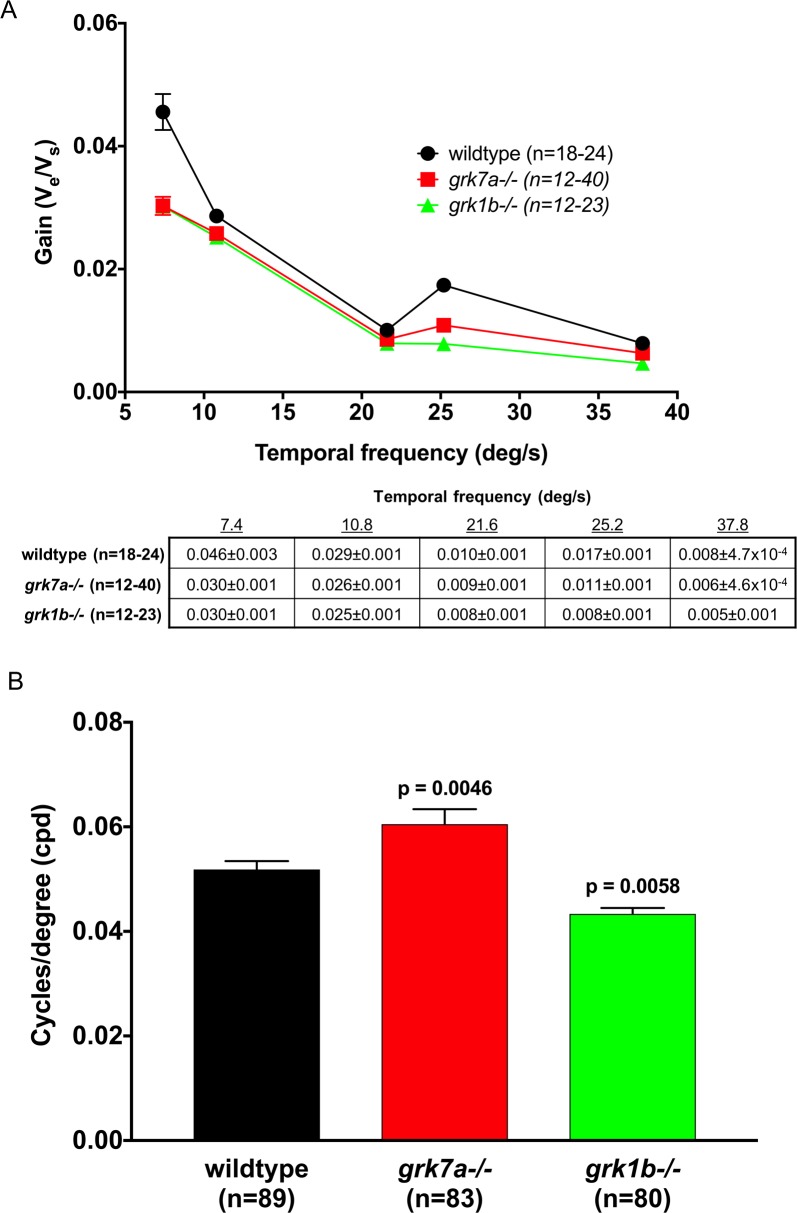
Figure 6.
Temporal contrast sensitivity and visual acuity of grk1b and grk7a knockout larvae. Optokinetic response measurements of larval knockout zebrafish at 6 dpf. (A) Optokinetic gain as function of temporal frequency of a sinewave grating. A linear mixed model analysis of covariance found a significant effect of genotype when compared to wildtype for grk1−/− (F[1,209] = 32.9; P < 0.001) and grk7a−/− (F[1,193] = 21.4; P < 0.001) larvae. The accompanying table shows all means and standard errors from the graph. (B) Visual acuity measured in cycles/degree (cpd). P-values were obtained using the Bonferonni post hoc test following 1-way ANOVA. Error bars represent SEM.

