Figure 11.

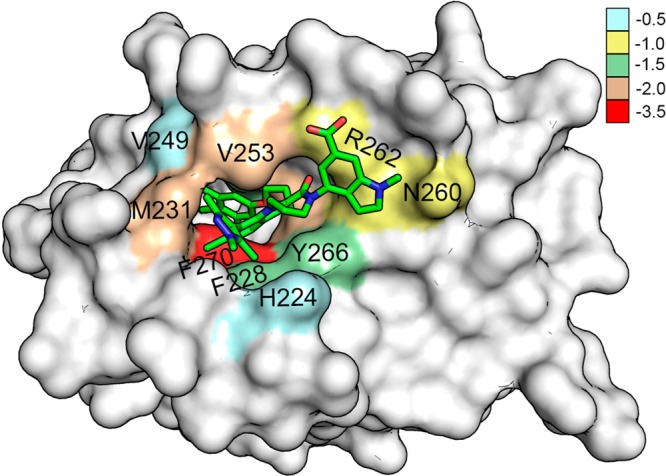
Distribution of BFE (kcal/mol) values depicted over the residues at the P2 binding pocket of Mcl1 (molecular surface representation) complexed with compound 5.

Distribution of BFE (kcal/mol) values depicted over the residues at the P2 binding pocket of Mcl1 (molecular surface representation) complexed with compound 5.