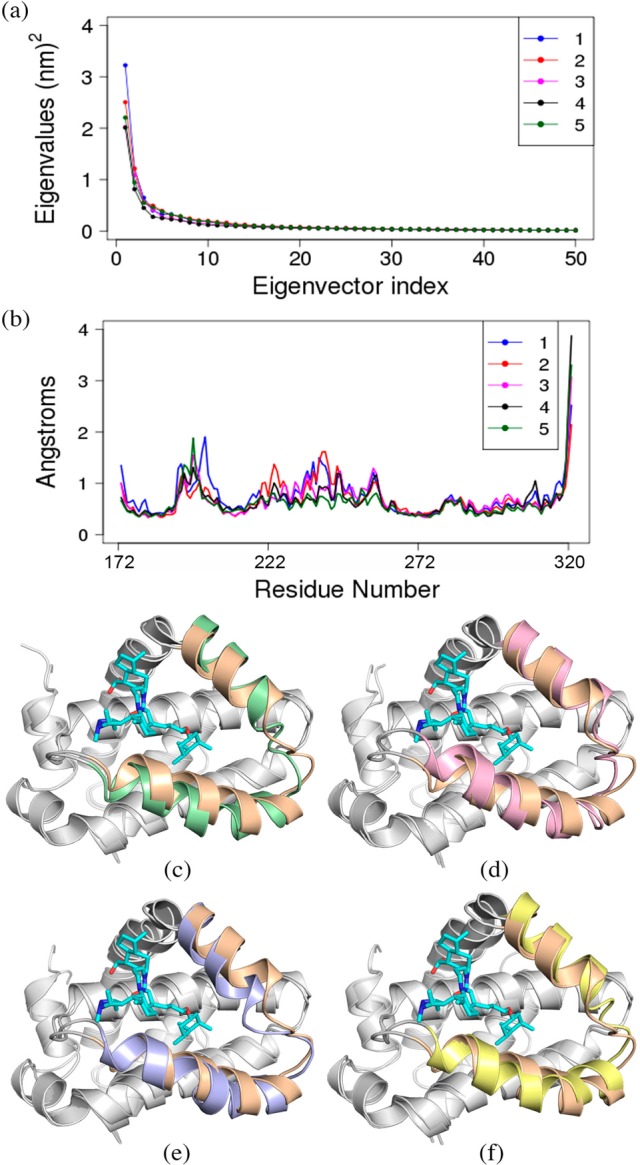
Figure 7.

Principle Component Analysis for Mcl1–inhibitor complexes. (a) The eigenvalues plotted against eigenvector indices from the Cα covariance matrices. (b) Internal fluctuation obtained for first eigenvector obtained for Mcl1–inhibitor complexes. Superposition of Mcl1 (light brown) complexed with compound 5 (cyan color) over (c) Mcl1 (green) with compound 1, (d) Mcl1 (pink) with compound 2, (e) Mcl1 (purple) with compound 3 and (f) Mcl1 (yellow) with compound 4.
