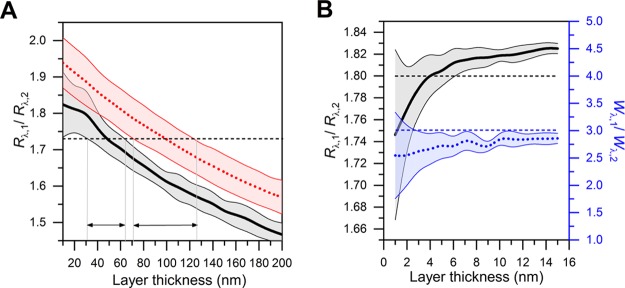
Figure 4.
(A) Calculated ratio of SPR responses for SVLs at a low coverage (thick black solid line, n = 1.34–1.35, dn/dλ = −0.024 × 10⁻³ nm–1) and at higher coverage (thick red dotted line, n = 1.35–1.37, dn/dλ = −0.04 × 10⁻³ nm–1). Horizontal dashed line corresponds to the experimental average for SVLs, while the regions defined by the arrowheads correspond to the possible ranges of layer thickness values at that experimental value (1.73). (B) Ratio of SPR responses (thick black solid line) and the ratio of shifts in SPR peak width (thick blue dashed line), n = 1.47–1.49, dn/dλ = −0.04 × 10⁻³ nm–1). Horizontal dashed lines represent the experimental average values for SLBs. Solid thin lines show the error boundaries of the calculation averaged over the described refractive index range.

