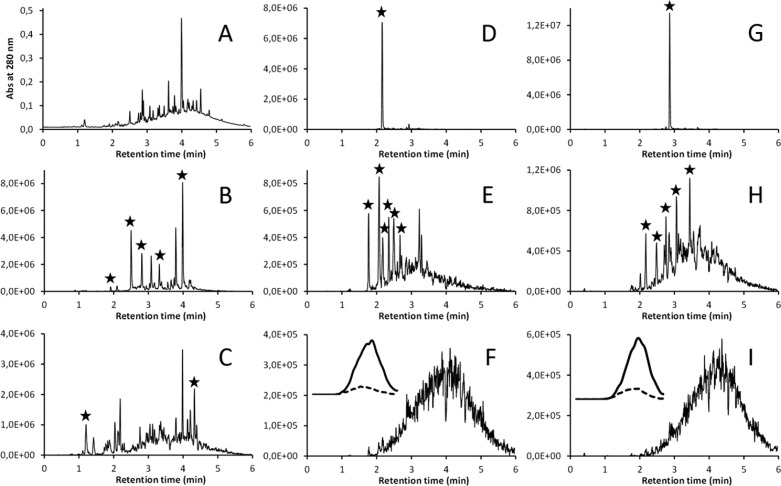
Figure 2.
Examples of the UHPLC–DAD–MS/MS fingerprints recorded by the Engström method in a single run for the E. calycogona subsp. miracula leaf sample: (A) UV traces at 280 nm, (B) HHDP fingerprint, (C) galloyl fingerprint, (D) (epi)gallocatechin fingerprint, (E) PD oligomer fingerprint, (F) PD polymer fingerprint, with the inset showing the PD extension unit (bold line) and terminal unit (dashed line) fingerprints after 30 smoothing operations to the raw data, (G) (epi)catechin fingerprint, (H) PC oligomer fingerprint, and (I) PC polymer fingerprint, with the inset showing the PC extension unit (solid line) and terminal unit (dashed line) fingerprints after 30 smoothing operations to the raw data. The five main UV peaks at panel A are presented by flavonol glycosides and caffeoyl quinic acids that can be detected by the Engström method as well (kaempferol, quercetin, myricetin, and quinic acid fingerprints). The peaks with asterisks show the tannins that could be characterized by the help of the 2D fingerprints and the full-scan mass spectra.

