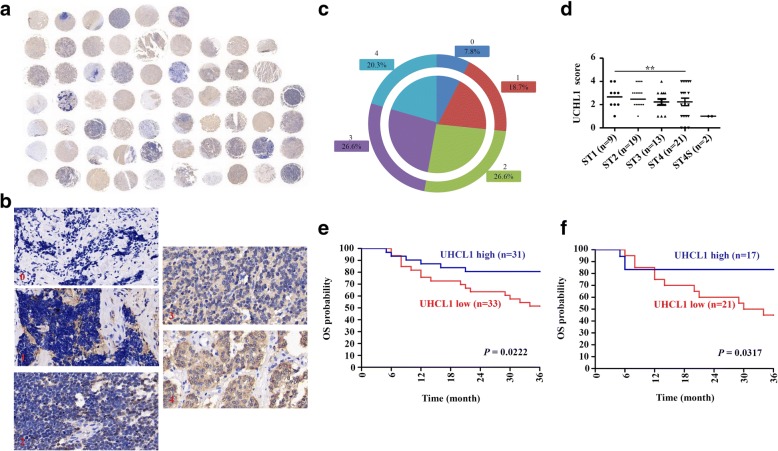
Fig. 1.
Expression and roles of UCHL1 in TMA of neuroblastic tumors. a A general observation of UCHL1 expression in TMA of 64 neuroblastic tumor samples. b-c Representative images with five scores (0–4) of IHC staining of UCHL1 expression in neuroblastic tumor samples, and the proportions of five scores were shown. d UCHL1 expression in stage (ST) 1-4S tumors. e Kaplan-Meier analysis of OS in TMA of 64 neuroblastic tumor samples based on UCHL1 expression with the log-rank test P value indicated. f Kaplan-Meier analysis of OS of 38 NB samples among the TMA cohort of based on UCHL1 expression with the log-rank test P value indicated. Values are shown as mean ± S.E.M. and statistical significance indicated as ** P < 0.01

