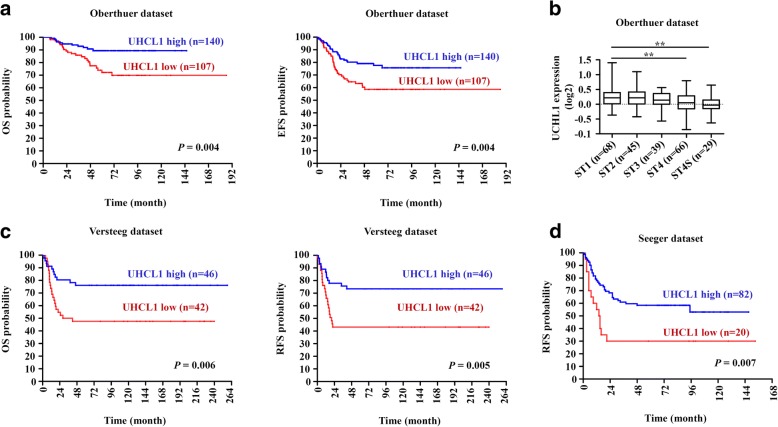
Fig. 2.
UCHL1’s prognostic value in validation datasets. a Kaplan-Meier analysis of OS and EFS for the Oberthuer dataset based on UCHL1 expression with the log-rank test P value indicated (n = 247). b Box plot of UCHL1 expression levels in stage (ST) 1-4S tumors. c Kaplan-Meier analysis of OS and EFS for the Versteeg dataset based on UCHL1 expression with the log-rank test P value indicated (n = 88). d Kaplan-Meier analysis of OS and relapse-free survival (RFS) for the Seeger dataset based on UCHL1 expression with the log-rank test P value indicated (n = 102). Values are shown as mean ± S.E.M. and statistical significance indicated as ** P < 0.01

