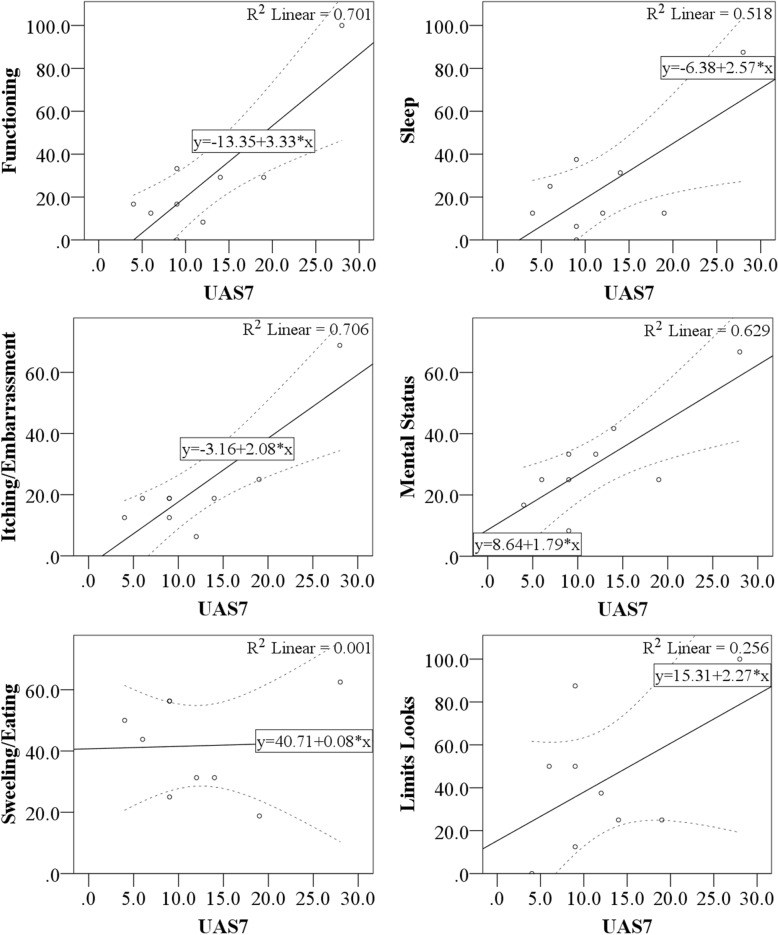
Fig. 4.
CU-Q2oL domains’ scores as a function of UAS7 scores. Each CU-Q2oL domain value in Y axis is expressed as a function of UAS7 on X axis, as depicted on each upper right box. All correlations were statistically significant, except for swelling/eating and limits looks. Continuous line represents the linear regression line of best fit, whilst dashed lines are confidence intervals (95%). UAS7, Urticaria Activity Score 7; CU-Q2oL, Chronic Urticaria Quality of Life; R2 linear, coefficient of determination

