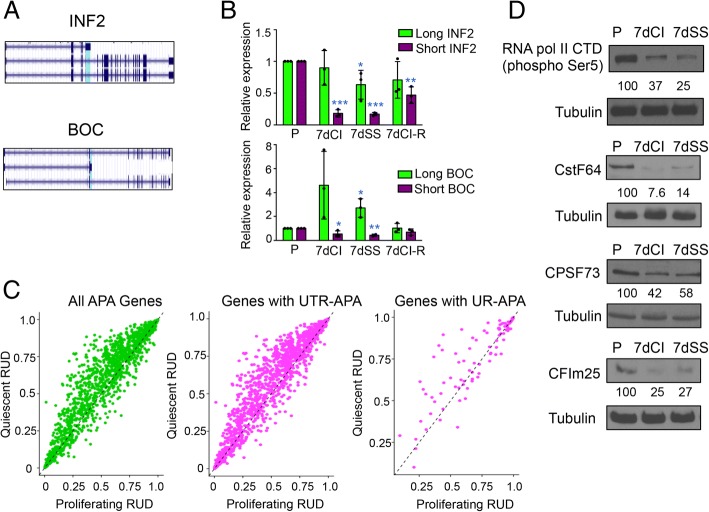
Fig. 3.
Use of distal polyadenylation sites and lower levels of cleavage and polyadenylation factors during quiescence. a UCSC Genome browser views showing the long and short isoforms of INF2 and BOC. The differentially expressed exon is highlighted in cyan. b Real-time PCR validation of APA with quiescence. cDNA samples generated from fibroblasts that were proliferating, quiescent by contact inhibition or serum starvation, or induced into quiescence by serum-starvation and then restimulated, were analyzed with real-time PCR. Primers were designed to recognize the short (terminating at the proximal polyadenylation site) or long (terminating at the distal polyadenylation site) isoforms of INF2 or BOC. Transitioning fibroblasts into quiescence resulted in reduced expression of the short isoform of INF2 and increased expression of the long isoform of BOC. Restimulating quiescent fibroblasts resulted in expression patterns of the short and long isoforms that more closely resemble proliferating cells. Plots show individual datapoints as dots. Bar graphs represent mean and average ± S.D. The number of replicates for all conditions for short and long INF2 is 3. The number of replicates for all conditions for long BOC is 3. The number of replicates for P, 7dCI, and 7dCI-R for short BOC is 3. The number of replicates for 7dSS for short BOC is 2. Statistical significance in knockdown cells compared to control cells was determined for long and short isoforms with two-tailed, unpaired t tests. For all figures, one asterisk indicates p value < 0.05. Two asterisks indicate p value < 0.01. Three asterisks indicate p value < 0.001. c A shift toward expression of longer isoforms in quiescent fibroblasts. Proliferating and 7dCI were analyzed by polyadenylation site-enriched RNA-Seq. Relative use of the distal polyadenylation site (RUD) for individual genes in proliferating fibroblasts is plotted on the x-axis and RUD for the same gene in quiescent conditions is plotted on the y-axis. The dashed black line indicates y = x. The first plot (left) displays all genes with two detected polyadenylation sites. The middle plot displays UTR APA genes and the final plot (right) shows the same data for genes that undergo UR APA. d Immunoblotting was performed on protein lysates collected from proliferating, 7dCI and 7dSS fibroblasts for CstF-64, CFIm25, and CPSF73. Phosphorylation of serine 5 on RNA pol II CTD was monitored by immunoblotting and levels decline with quiescence. α-Tubulin was monitored as a loading control

