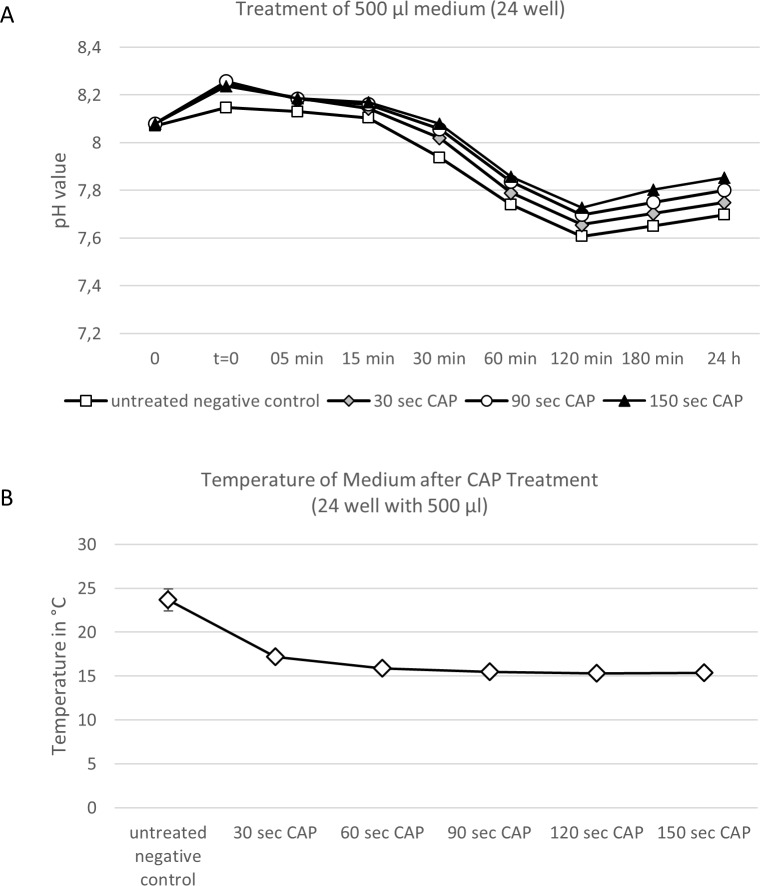
Fig 5. Treatment with cold atmospheric influences pH and temperature of aqueous solutions used in this study.
(A) pH values after CAP treatment. 500 μl medium were treated by different time doses (no treatment, 30, 60, 90, 120, and 150 seconds) without adding virus. A distance of 15 mm to the medium surface was maintained and pH values were measured 5, 15, 30, 60, 120, 180 and 24 hours after treatment. (B) Temperature measurement after CAP treatment. A digital temperature measurement was performed 30, 60, 90, 120 and 150 after CAP treatment. Experiments were performed in triplicates and repeated 3 times. Mean +/- standard deviation are shown.

