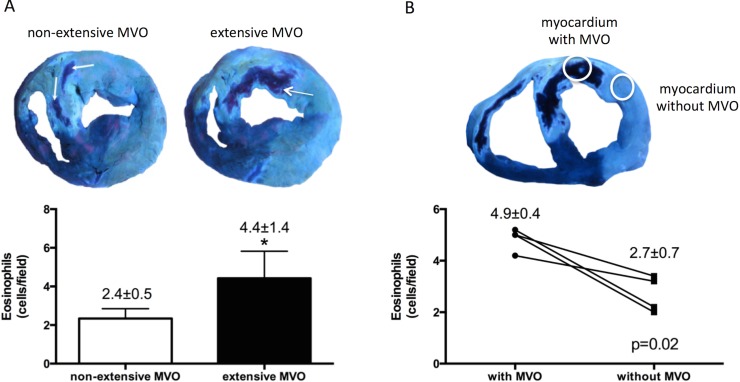
Fig 4. Infiltration of eosinophils into the infarcted areas with microvascular obstruction (MVO).
(A) Quantification of infiltrated eosinophils according to the extension of MVO. Animals from the 3-days and 7-days reperfusion groups were categorized according to MVO (extensive: MVO> 5% of area at risk, median value) and the number of eosinophils was morphometrically quantified. (B) Quantification of infiltrated eosinophils in samples obtained from the same heart but comparing infarcted areas with macroscopic MVO and without MVO from the same heart.

