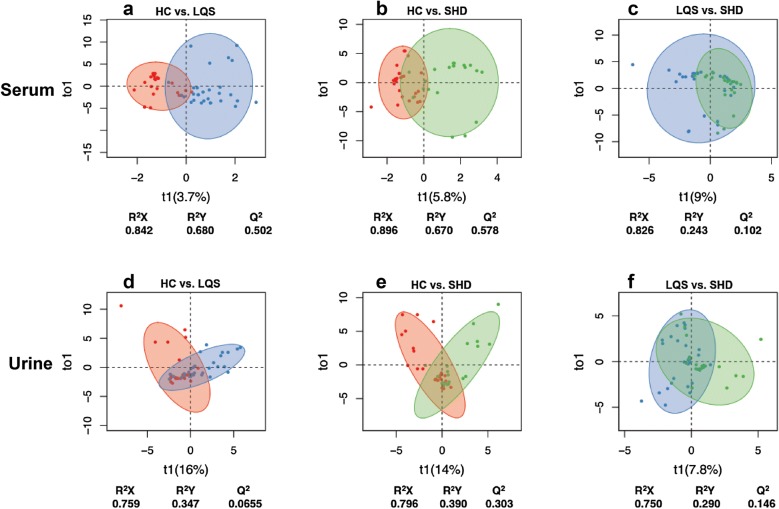
Fig. 3.
Clustering analysis of serum (a, b, c) and urine (d, e, f) metabolomic profiles. OPLS-DA models were built in patients with Liver Qi Stagnation (LQS) and Heart and Spleen Deficiency (HSD) subtypes of MDD and healthy controls (HC). Acceptable criteria for the models were defined as all R2X, R2Y, and Q2 values of ≥ 0.5. Comparisons were conducted between HC and LQS (a, d), HC and HSD (b, e), and LQS and HSD (c, f)

