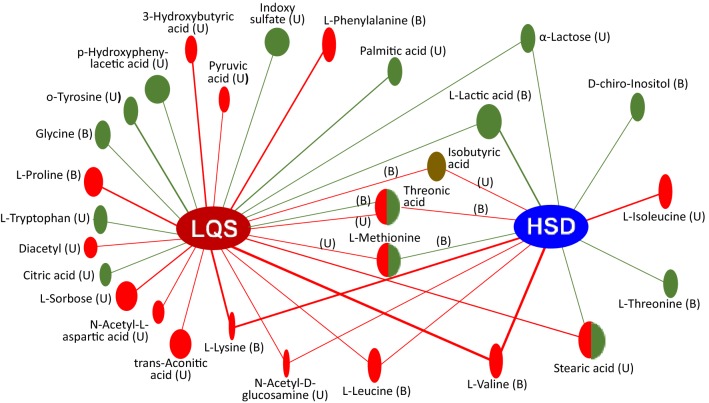
Fig. 6.
Correlation network analysis of 28 differential metabolites among Liver Qi Stagnation (LQS) and Heart and Spleen Deficiency (HSD) subtypes of MDD versus healthy controls. Green and red lines with ovals indicates negative and positive correlation, respectively. The ovals with half green and half red colors indicate mixed correlations. The oval size represents p value compared with healthy controls. Isobutyric acid (dark brown oral) has a significant difference between the two subtypes. B blood samples, U urine samples

