
Fig. 3.
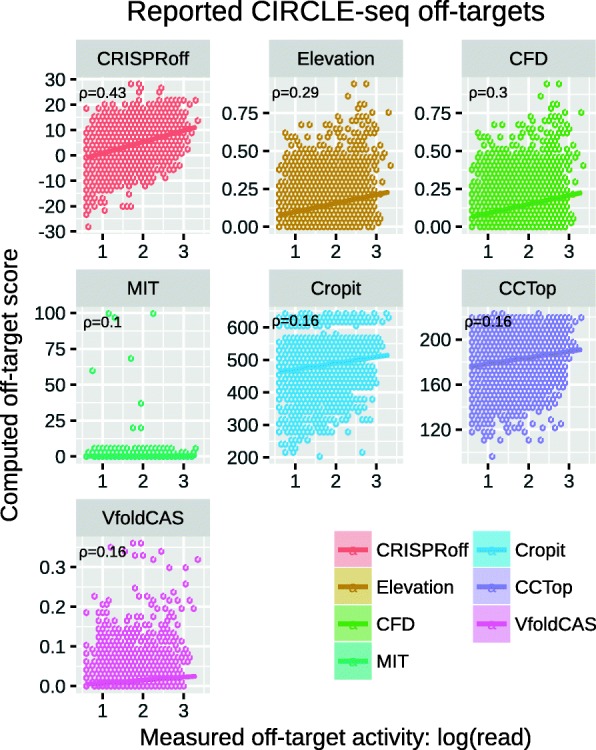
Method-specific off-target score vs. off-target activity scatterplots (hexagonal binned) with all reported off-targets from CIRCLE-seq dataset. Measured off-target activity, given on the x-axis, corresponds to the logarithm of read counts reported for that specific off-target region. Fitted lines are shown together with the Pearson correlation coefficient between x- and y-axis variables in the top left corner of each subplot