
Fig. 4.
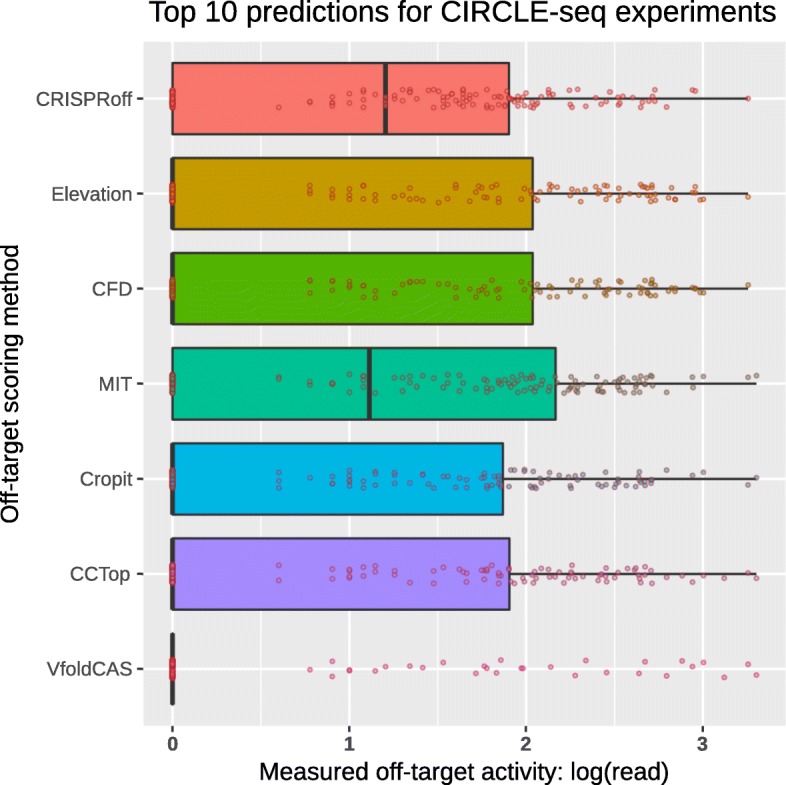
CIRCLE-seq measured off-target activity distributions of method-specific top predictions (180 in total, top 10 for all 18 experiments). Distributions are given separately for each method in box plot format combined with log(read) values for each off-target prediction as dot plots. Value 0 in x-axis corresponds to no experimental support for that off-target prediction