
Fig. 5.
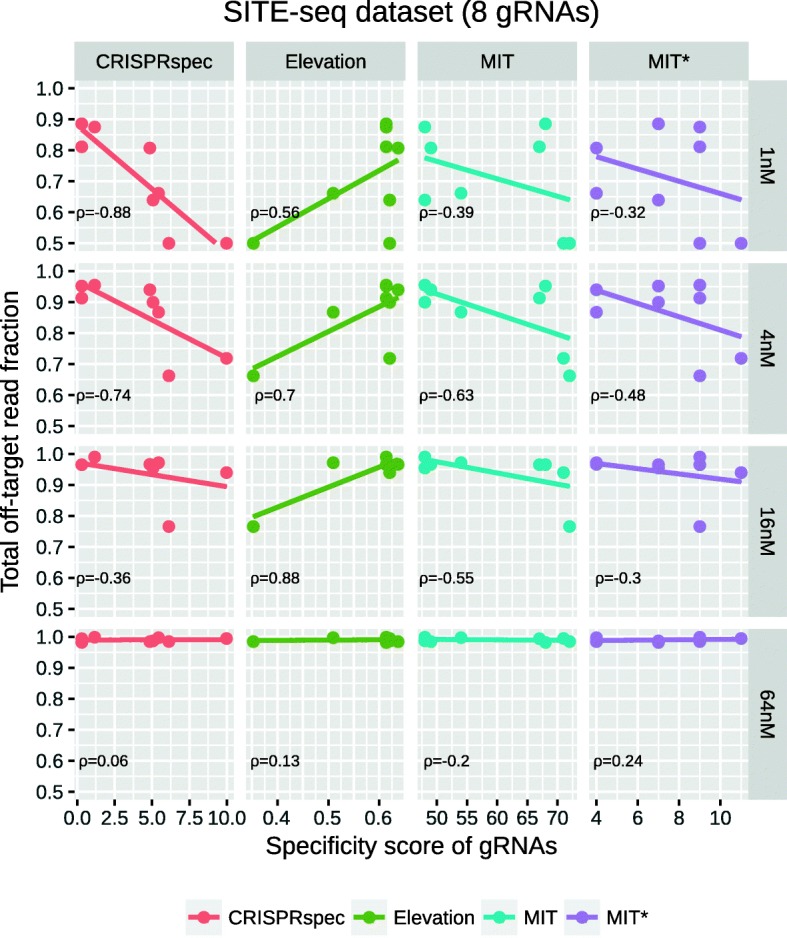
Total off-target activity reported by the SITE-seq experiments vs. method-specific specificity scores for eight unique gRNAs. For each gRNA, the CRISPRspec and MIT* scores have been computed with the same set of off-target predictions allowing up to six mismatches, whereas Elevation scores are based on its own prediction set (up to six mismatches) and MIT score has been computed with CRISPOR tool [11] allowing up to four mismatches in off-target predictions by default. Results regarding to different concentration levels in the SITE-seq dataset are given separately at each row. Fitted lines are shown together with the Pearson correlation coefficient between x- and y-axis variables in the bottom left corner of each subplot