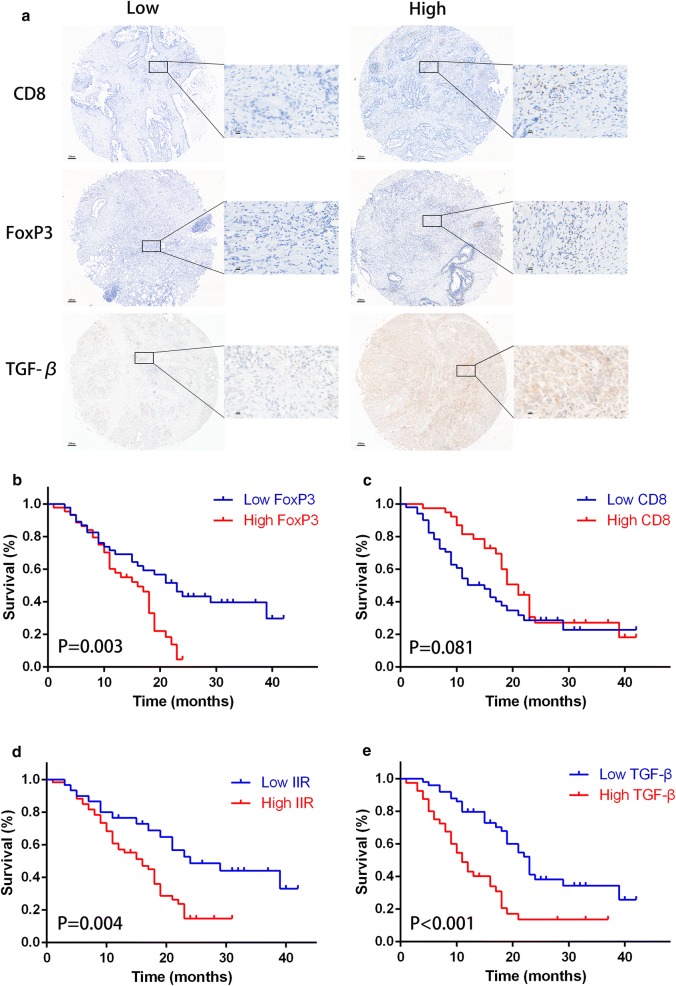
Fig. 1.
The immunohistochemistry of CD8 and FoxP3 in tissue microarray and its associated survival. a The representative low and high expression of CD8, FoxP3 and TGF-β (×40 low-power and ×400 high-power fields respectively). Kaplan–Meier survival curves of b FoxP3, c CD8, d IIR and e TGF-β was showed and analyzed using Log-rank test

