
Fig. 3.
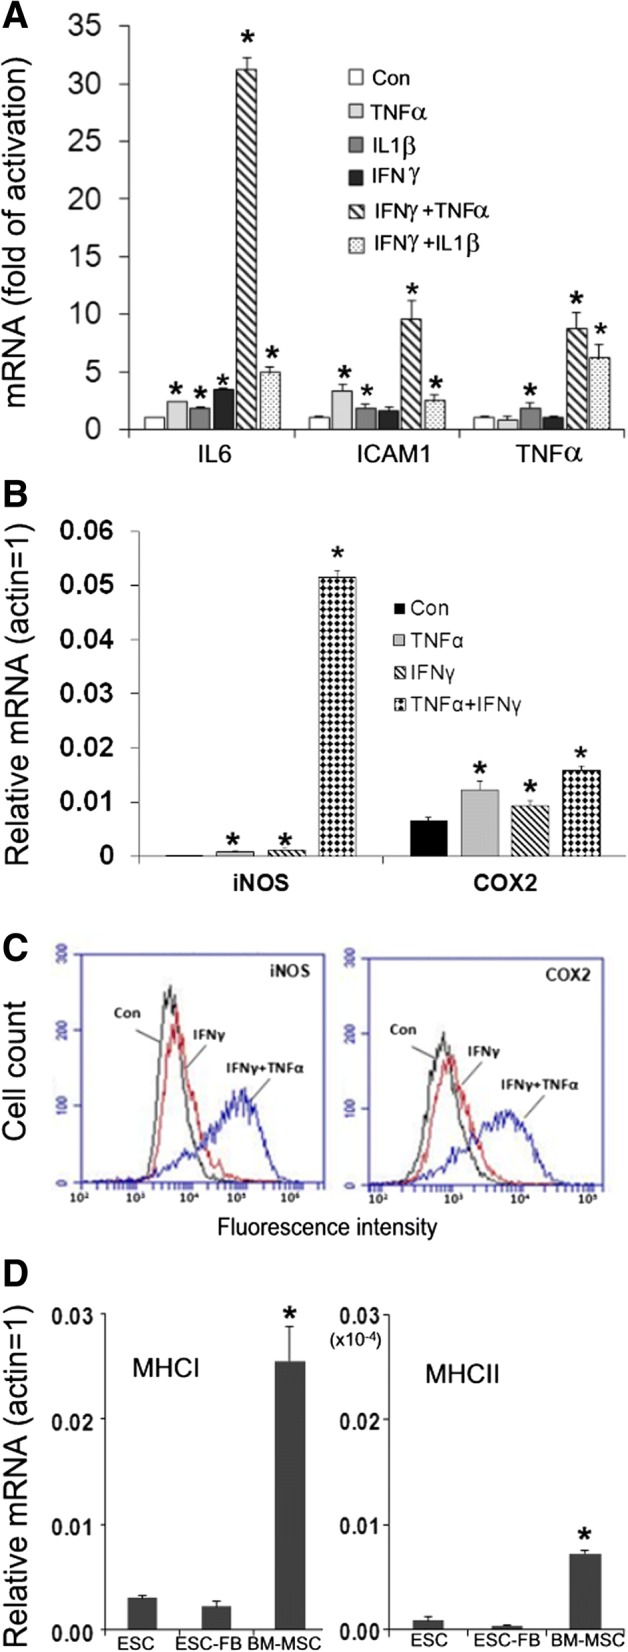
Immunologic properties of mESC-FBs. a Expression of immunomodulators induced by inflammatory cytokines. Cells were treated for 24 h with indicated cytokines, alone or in combination. The expression levels of IL6, TNFα and ICAM1 were determined by RT-qPCR analysis. b, c Analysis of IFNγ- and TNFα-induced iNOS and COX2 expression by RT-qPCR (b) and flow cytometry (c). d Comparative analysis of MHC expression in BM-MSCs, mESCs and mESC-FBs by RT-qPCR. Values in RT-PCR analysis are mean ± SD of data from three independent experiments. *p < 0.05, a, b, compared with respective controls (Con); d compared with ESC. The results in flow cytometry are representative experiments performed three times with similar results