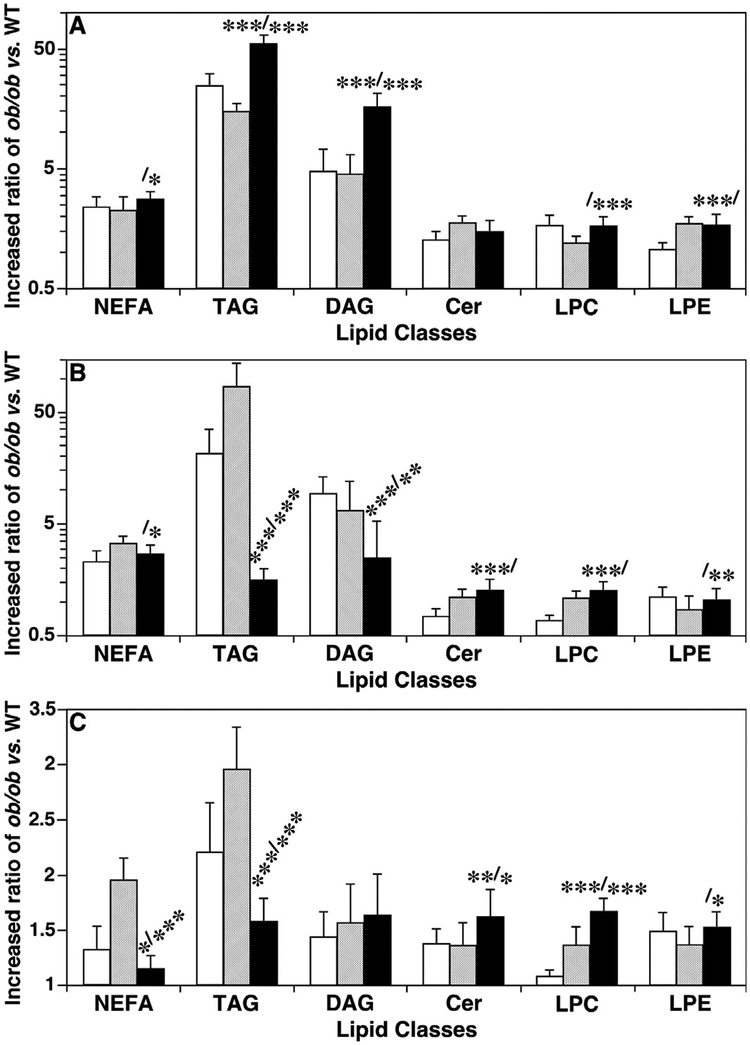
Fig. 1.
Temporal comparison of the increased ratios of lipotoxic lipid levels in the liver, muscle and heart of ob/ ob mice vs. their controls. Ratios were calculated by the lipid mass levels (accumulation of which represents lipotoxicity, and could lead to cell dysfunction or cell death) in ob/ ob vs WT mouse liver (Panel A), thigh skeletal muscle (Panel B), and heart (Panel C) at 10 (open bars), 12 (shaded bars), and 16 weeks (solid bars) of age by MDMS-SL as described in MATERIALS AND METHODS. NEFA, TAG, DAG, Cer, LPC, and LPE stand for non-esterified fatty acid, triacylglycerol, diacylglycerol, ceramide, lysophosphatidylcholine, and lysophosphatidylethanolamine, respectively. The statistical symbols indicate the statistical differences between 10 and 16 weeks (the symbols before the slash) and between 12 and 16 weeks (the symbols after the slash).

