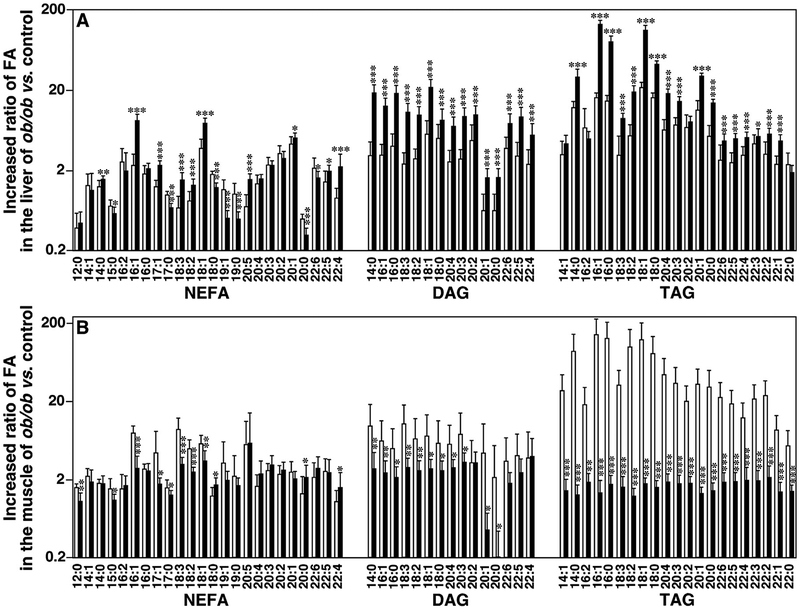
Fig. 2.
Temporal comparison of ratios of fatty acyl chains in liver and thigh skeletal muscle of ob/ ob mice vs. controls. Ratios were calculated by mass levels of non-esterified fatty acid (NEFA), diacylglycerol (DAG), and triacylglycerol (TAG) in mouse liver (Panel A) and thigh skeletal muscle (Panel B) at 12 (open bars) and 16 weeks (solid bars) of age by MDMS-SL as described in MATERIALS AND METHODS. Fatty acyl (FA) chain content in DAG and TAG was calculated from mass levels of individual species. Statistical significance was determined by a two-tailed Student t-test in comparisons with control, in which *p < 0.05, **p < 0.01, and ***p < 0.001.

