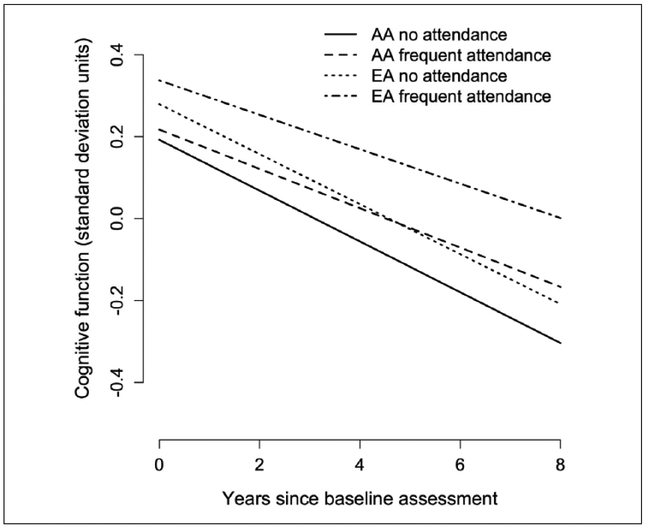
Figure 1.
Eight-year course of change in composite cognitive function by frequency of live performances and race/ethnicity.
Note. Solid line shows cognitive decline in AAs who never attended live performance, dashed line AAs with high frequency of attendance, dotted line EAs who never attended, and dotted and dashed line EAs with high frequency of attendance. AAs = African Americans; EAs = European Americans.

