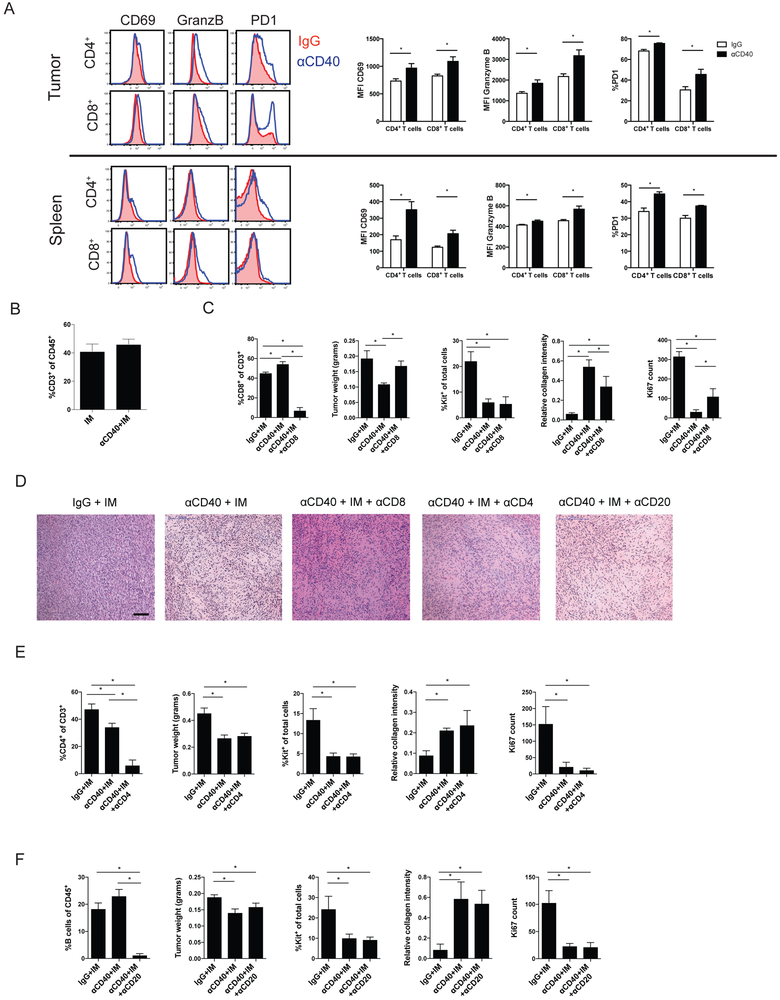
Figure 5. Anti-CD40 combination therapy is partially dependent on CD8+ T cells.
(A) Left: Histograms of CD69, granzyme B (GranzB), and PD-1 expression on CD4+ and CD8+ T cells from the tumor (top) and spleen (bottom) of KitV558Δ/+ mice (5–6 mice/group) 3 days after injection of IgG (red) or anti-CD40 (αCD40; blue). Right: Quantitation of results. MFI, mean fluorescence intensity. (B) CD3+ T cells as percentage of CD45+ cells in the tumor. (C) CD8+ T cells as percentage of CD3+ T cells in the tumor, tumor weight, Kit+ tumor cells as percentage of total cells, collagen staining by Trichrome, and Ki67 count representing the number of positively stained nuclei in one 800 × 720 μm field in KitV558Δ/+ mice at 2 weeks that were depleted of CD8+ T cells and treated as indicated (7 mice/group). Imatinib: IM (D) Representative H&E tumor sections at 2 weeks. Bar represents 100 μm. (E) CD4+ T cells as percentage of CD3+ T cells in the tumor, tumor weight, Kit+ tumor cells as percentage of total cells, collagen staining by Trichrome, and Ki67 count representing the number of positively stained nuclei in one 600 × 600 μm field in KitV558Δ/+ mice depleted of CD4+ T cells at 2 weeks (3-5 mice/group). (F) B cells as percentage of CD45+ cells, tumor weight and Kit+ tumor cells as percentage of total cells, collagen staining by Trichrome, and Ki67 count representing the number of positively stained nuclei in one 600 × 600 μm field in KitV558Δ/+ mice depleted of B cells at 2 weeks (6-7 mice/group). Data represent 2 experiments, mean ± SEM, *P < 0.05 using Student’s t test.

