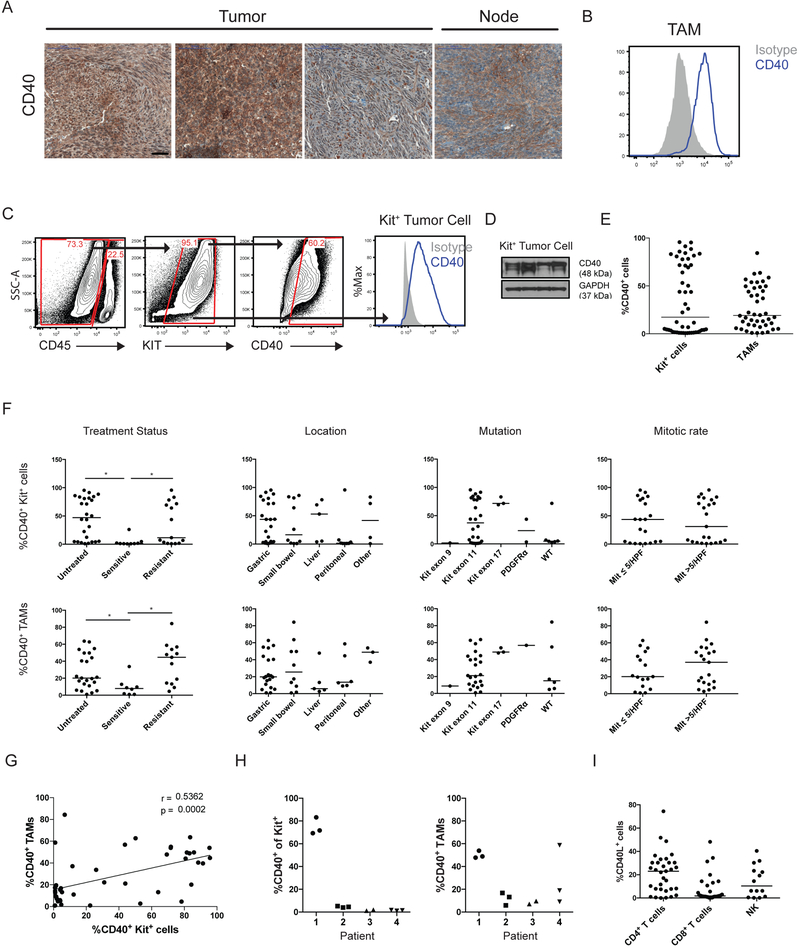
Figure 7. CD40 is expressed in human GISTs and correlates with treatment status.
(A) Representative CD40 staining in selected human GISTs, with lymph node (Node) as a positive control. Bar represents 50 μm. (B) Representative histogram of CD40 expression (blue) on human GIST TAMs by flow cytometry compared to isotype (gray). (C) Representative gating of CD40+Kit+CD45− tumor cells in human GIST (left) and histogram of CD40 expression (right, blue) on human Kit+ tumor cells by flow cytometry compared to isotype (gray). (D) Western blot of Kit+ tumor cells isolated from 4 separate human GIST specimens. (E) Dot plot of percentage of CD40+ Kit+ tumor cells (n=50) and TAMs (n=44) by flow cytometry, and (F) the results were stratified by treatment status, location, mutation, and mitotic rate. “Untreated” tumors were from patients who never received a tyrosine kinase inhibitor before surgery. “Sensitive” tumors were responding to imatinib or another tyrosine kinase inhibitor at the time of surgery. “Resistant” tumors were progressing despite treatment with imatinib or another tyrosine kinase inhibitor. (G) Spearman correlation of linear regression analysis comparing percentage of CD40+ Kit+ tumor cells and CD40+ TAMs from individual human GISTs by flow cytometry. (H) Percentage of CD40+ Kit+ tumor cells (left) and TAMs (right) by flow cytometry among different tumors from the same patient (n=4). (I) Percentage of CD40L+ T cells (CD45+CD3+NK1.1−) and NK cells (CD45+CD3−NK1.1+) within the tumor as assessed by flow cytometry. Bar represents median, *P < 0.05 using Student’s t test unless otherwise indicated.

