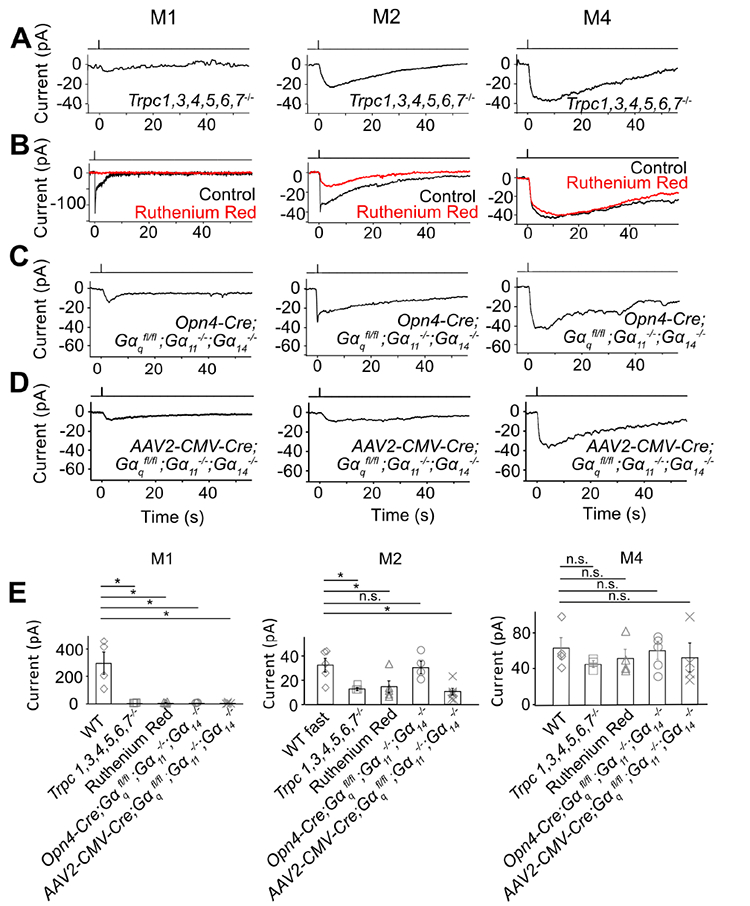
Figure 2. The unknown phototransduction pathway is independent of TRPC and Gαq family members.

(A-D) Saturated light responses of M1-, M2- and M4-cells of various genetic backgrounds or with 20-μM Ruthenium Red. Light stimulation and recording condition are the same as in Figure 1. (E) indicates averaged data (mean ± SEM, n = 4, 3, 4, 3, 4; 5, 3, 5, 4, 6; 4, 3, 4, 5, 4 cells from at least 2 animals in each group). * indicates p < 0.05 and n.s. indicates not statistically significant. Note that, in (B) middle, the apparent reduction in the slow component of the M2-response by Ruthenium Red represents actually the removal of the slow decline of the fast component; indeed, Ruthenium Red showed no effect on Trpc6,7−/− M2-cells (not shown). In (C) left, 3 out of 5 Opn4-Cre;;; M1-ipRGCs had a very small residual response, but the remaining two M1-cells gave a normal-looking response (not shown and not included in (E) left); in (C) middle and right, the Opn4-Cre;;; M2- and M4-ipRGC also appeared normal, probably due to weak Opn4 promoter and thus Cre-recombinase activity (see text). In (D), 4 out of 4 AAV2-CMV-Cre-infected M1-ipRGCs showing GFP-fluorescence (thus indicating successful infection) had a small residual response, 6 out of 6 infected M2-ipRGCs showing GFP-fluorescence lost the fast response component, and 4 out of 4 M4-ipRGCs showing GFP-fluorescence had normal-looking responses. In (E), the indicated WT cells were actually those used in the Ruthenium Red experiments but before Ruthenium Red application (thus distinct from those indicated from those in Figure 1E, although giving similar photocurrents). See also Figure S2.
