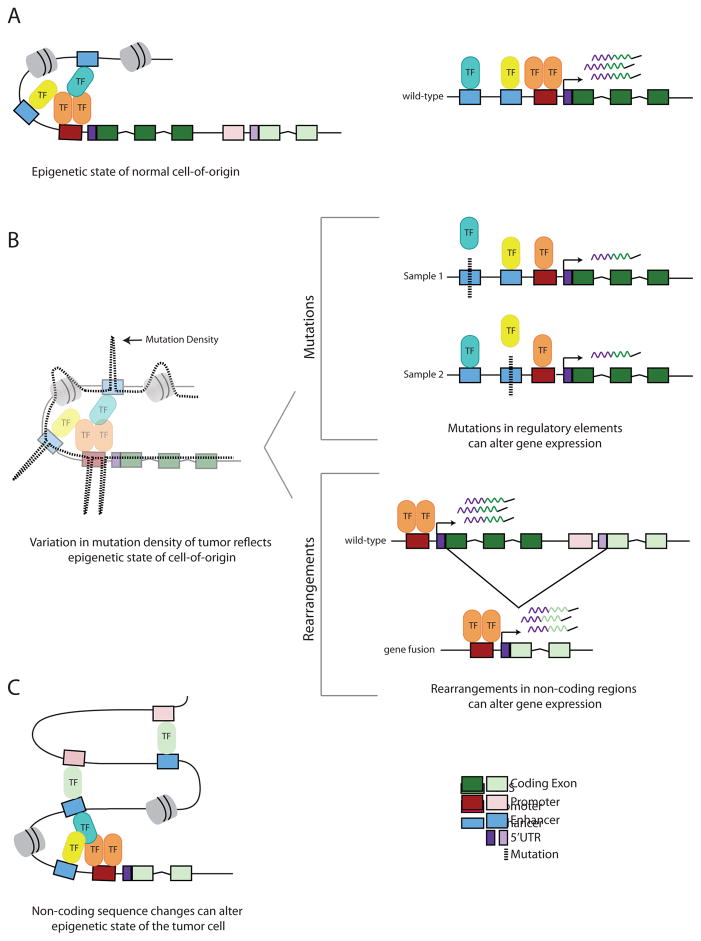
Figure 1. Schematic showing the interplay between non-coding genetic variation and epigenetic state in cancer.
A) The epigenetic state of the tumor cell-of-origin. Two genes and two nucleosomes (gray) are shown. On the right is a zoomed in diagram of one of these genes being actively transcribed. B) As the cell turns from normal to malignant, the variation in somatic mutation density reflects the epigenetic state of the tumor cell-of-origin. TFBS within active regions have elevated mutations rates due to inefficient NER (for example, in melanoma and lung cancer), while regions of open chromatin flanking active TFBS have decreased mutation rates. Regions of closed chromatin exhibit elevated mutation rates relative to accessible regions. Sequence variants can be point mutations or rearrangements. In the mutations panel, a mutation (dashed black line) in either enhancer causes a decrease in gene expression by modulating TF-binding affinity (e.g. only one TF binds the promoter). This regulatory architecture can decrease power to detect associations between mutations in a single regulatory element and the target gene. In the rearrangements panel, there is an intergenic deletion resulting in a fusion between the 5′ UTR of one gene with the exons of the other gene (e.g. TMPRSS2-ERG), resulting in overexpression of the fusion gene (e.g ERG overexpression in prostate cancer). C) Non-coding sequence changes can alter epigenetic state in the cancer cell. Overexpression of the fusion gene product (as shown in B) (e.g. ERG, light green TF) can alter the 3D chromatin topology by mediating new promoter-enhancer linkages. Additional genes in this region are omitted for clarity.

