

Abstract
Dissolved organic matter (DOM) in freshwater environments is an important source of organic carbon, supporting bacterial respiration. Frozen environments cover vast expanses of our planet, with glaciers and ice-sheets storing upwards of six petagrams of organic carbon. It is generally believed that DOM liberated from ice stimulates downstream environments. If true, glacial DOM is an important component of global carbon cycling. However, coupling the release of DOM to microbial activity is challenging due to the molecular complexity of DOM and the metabolic connectivity within microbial communities. Using a single environmentally relevant organism, we demonstrate that processing of compositionally diverse DOM occurs, but, even though glacially derived DOM is chemically labile, it is unable to support sustained respiration. In view of projected changes in glacier DOM export, these findings imply that biogeochemical impacts on downstream environments will depend on the reactivity and heterogeneity of liberated DOM, as well as the timescale.
Keywords: dissolved organic matter, biological lability, exometabolomics, carbon cycling, FT-ICR MS
The transport of organic carbon (OC) through freshwater ecosystems is central to the global carbon cycle. Rivers and estuaries play a fundamental role in the transport of carbon as they link freshwater and marine ecosystems, transporting 0.9 petagrams of OC per year to the oceans (Cole et al. 2007). Within freshwater habitats, dissolved organic matter (DOM) is an important source of OC supporting microbial respiration. DOM, a heterogeneous mixture of labile and recalcitrant compounds (Mopper et al. 2007; Vahatalo et al. 2010), is present along a reactivity spectrum in all freshwaters. DOM reactivity is determined by both the molecular composition of DOM constituents and the metabolic capacity of the ecosystem, ultimately affecting trophic interactions and influencing aquatic food web dynamics.
DOM reactivity is not only a consequence of its composition and the in situ microbial communities, but also different physical and biological processes at play across aquatic environments. Laboratory experiments examining the utilization of DOM generally use glucose or combinations of amino acids (Nelson and Carlson 2012; Nikrad et al. 2012; Jørgensen et al. 2014; Lechtenfeld et al. 2015). Unfortunately, these commercially available substrates lack environmental relevance and the chemical complexity of naturally occurring DOM. To address the linkage between the decomposition and chemical reactivity of freshwater DOM, this study used different sources of environmental end-member DOM, including: microbially derived DOM from the Cotton Glacier stream, Antarctica (CG); microbially derived DOM from the eutrophic Pony Lake, Antarctica (PL); and as a counterpoint terrestrially derived DOM from the Suwannee River, USA (SR). The two Antarctic carbon sources were selected because the lack of higher order plants and simplified foodwebs makes Antarctica an optimal environment to study the processing of microbially-derived freshwater DOM. Further, investigations from diverse environments show that glacially derived DOM can be highly bioavailable to microorganisms (Hood et al. 2009; Lawson et al. 2014; Bhatia et al. 2013; Smith et al. 2017), suggesting that glaciers are a reservoir of chemically reactive DOM.
While increasingly recognized that the intrinsic properties of DOM dictate the extent of microbial processing (Guillemette and del Giorgio, 2011), it remains poorly resolved which fractions of DOM are degraded and how shifts in composition translate into rates of processing. Coupling changes in DOM composition to in situ microbial community processing is difficult due to the molecular complexity of DOM and the phylogenetic diversity of natural microbial assemblages. Single organism studies provide a way to resolve the contributions of individual microorganisms to bulk processing. Recent evidence indicates that individual species of marine organisms can affect ecosystem-wide processes, and may be responsible for significant DOM fluxes and nutrient mineralization (Pedler et al. 2014). Currently, our understanding of biological DOM processing is dominated by oceanographic studies (Mou et al. 2008; Jiao et al. 2010; Kujawinski 2011; Nelson and Carlson 2012; Jiao et al. 2013; Hansell and Carlson 2014), with far less known in freshwater environments. Thus, there is a significant gap in knowledge regarding how individual organisms interact with complex DOM from freshwater sources.
The aim of this study was to determine the relationship between the intrinsic reactivity of environmentally isolated sources of freshwater DOM and microbial decomposition over time. To characterize these complex interactions, a combination of exometabolomic, microbiological, and biogeochemical techniques were employed.
Materials and Methods
Experimental Organism
Janthinobacteria are gram negative, motile, aerobic, rod-shaped microorganisms found in soil and aquatic environments globally. They are members of the Proteobacteria phylum and class Betaproteobacteria. Janthinobacterium sp. strain CG3 (CG3) was isolated from a supraglacial stream on the Cotton Glacier, Antarctica. The CG3 genome is 6.12 Mbp (Smith et al. 2013) and specifically chosen because it possesses genetic evidence for several central carbon metabolisms, both aerobic and fermentative (see SI for more details).
Experimental setup
To investigate the biological transformation of freshwater DOM of varying reactivity, we conducted extended incubations under environmentally relevant conditions. Incubations remained axenic for the duration of the experiment (see SI). CG3 cells were inoculated (final concentration 105 cells/mL) into a carbon free minimal M9 media (Difco). The carbon source amendments used included: microbially derived DOM from the oligotrophic supraglacial Cotton Glacier stream, Antarctica (CG), microbially derived DOM from the eutrophic coastal pond, Pony Lake, Antarctica (IHSS Pony Lake Fulvic Acid; PL), and terrestrially derived DOM from the Suwannee River, USA (IHSS Natural Organic Matter; SR). The three amendments (CG, PL, and SR) were added to combusted amber bottles, to a mass-balanced final concentration of 5 mg/L C. All samples were incubated for 98 days at 15°C, in the dark, and shaken at 30 rpm. Samples were monitored for bacterial contamination and cell abundances four times over the course of the experiment (see SI Table S2). A destructive sampling design was used for extracellular emission matrices (EEMs) and exometabolite analysis with five replicates and corresponding abiotic controls.
Cellular respiration
A Micro-Oxymax closed-circuit respirometer (Columbus Instruments) was used to continuously measure O2 concentrations during the extended incubations. Each carbon source plus bacterial cells were run in triplicate and included a blank without cells. Blank values were subtracted at each timepoint. Details of the statistical analyses of the respirometery data are provided in the SI.
Fluorescence spectroscopy
DOM fluorescence signatures were analyzed by EEMs according to (D’Andrilli et al. 2013) on a Fluoromax-4 spectrofluorometer (HORIBA Jobin-Yvon). Samples were analyzed for UV-Vis absorbance (190-1100nm) with a ThermoScientific Genesys10 scanning spectrophotometer on optically dilute samples (absorbance < 0.3 at 254 nm). EEMs data were post-processed to correct for instrument-specific bias using manufacturer-generated correction files for excitation, emission, and media blank subtraction (carbon free M9 minimal media). For temporal samples, EEMs were normalized according to the fluorescent intensity normalization calculation in the DOMFluor Toolbox (Stedmon and Bro 2008). Specific regions of fluorescence were defined for each carbon source corresponding to previously identified natural OM fluorophores (Coble 1996). For statistical analysis of OM fluorescence, EEMs were decomposed into individual fluorescing components using parallel factor (PARAFAC) analysis) with decomposition routines for excitation emission matrices; drEEM, v. 0.3.0) and the N-way scripts in MATLAB R2016b (Murphy et al., 2013, Stedmon and Bro, 2008; see SI)
External metabolite extraction
CG3 cells were removed from the microbiological media with 0.2μm, low-carbon binding filters. The filtered external metabolites were passed through Solid Phase Extraction PPL cartridges (Agilent Bond Elut) to concentrate DOM components and exometabolites and remove inorganic salts (Dittmar et al. 2008). Retained exometabolites were eluted into combusted glass vials with HPLC grade methanol, dried under nitrogen, and stored dark at −20°C prior to analysis.
UPLC-Q-TOF MS based exometabolite molecular constituent analysis
Mass spectra of external metabolites were obtained on a 1290 Ultra Performance Liquid Chromatography system coupled to a 6538 Ultra High Definition Accurate-Mass Quadrupole-Time of Flight mass spectrometer (UPLC-Q-TOF MS) operated in positive mode with an electrospray ionization (ESI) source (Agilent Technologies, see SI for details).
FT-ICR MS
CG, PL, and SR DOM lyophilized powders were reconstituted in HPLC grade methanol prior to Fourier transform ion cyclotron resonance mass spectrometry (FT-ICR MS). Mass spectra were obtained on a 9.4 Tesla FT-ICR mass spectrometer at the National High Magnetic Field Laboratory. Negative mode ESI and FT-ICR MS instrumental parameters are described in (D’Andrilli et al. 2013). Prior to analysis, negatively charged gaseous ions were produced with a custom-built ESI source (Emmett et al. 1998) and transferred into the mass spectrometer. Experimental parameters, mass spectral calibration, and peak list generation were optimized based on previous natural DOM analysis (D’Andrilli et al. 2013, D’Andrilli et al., 2015).
Results
Cellular respiration
Cellular respiration is a direct measure of metabolism, linking bacterial growth (see SI) to carbon utilization. To investigate specific metabolic rates, CG3 was grown with each of the carbon sources (CG, PL, and SR) with respiration measured every 24 hours for 98 days (Fig. 1A). All treatments supported microbial respiration. No significant difference in mean O2 consumption among treatments was observed during the first 17 days of the experiment (P>0.156). After 17 days, conversion rates of the carbon sources to CO2 differed between PL and both CG and SR (P<0.001). The first statistically significant difference in O2 consumption between CG and SR occurred at day 59 (P=0.0352), with O2 consumption remaining significantly different (P<0.001) for the duration of the experiment. Broken line regression analysis of all carbon sources identified significant break-points, indicating a difference in the rate of O2 consumption by CG3. Break-points were identified for CG at day 64 (P<0.001) and for SR at day 56 (P<0.001). No significant break-point was identified for PL (P>0.076). Overall, PL DOM supported the greatest rate of respiration for CG3 at 32.76 μL O2 consumed/day, followed by CG at 21.78 and SR at 20.17. After each break-point, CG3 respired the CG and SR DOM at reduced rates (18.82 and 16.02 μL O2 consumed/day). These break-points in linearity were used to inform sampling timepoints for UPLC-Q-TOF MS molecular constituent characterization.
Figure 1.
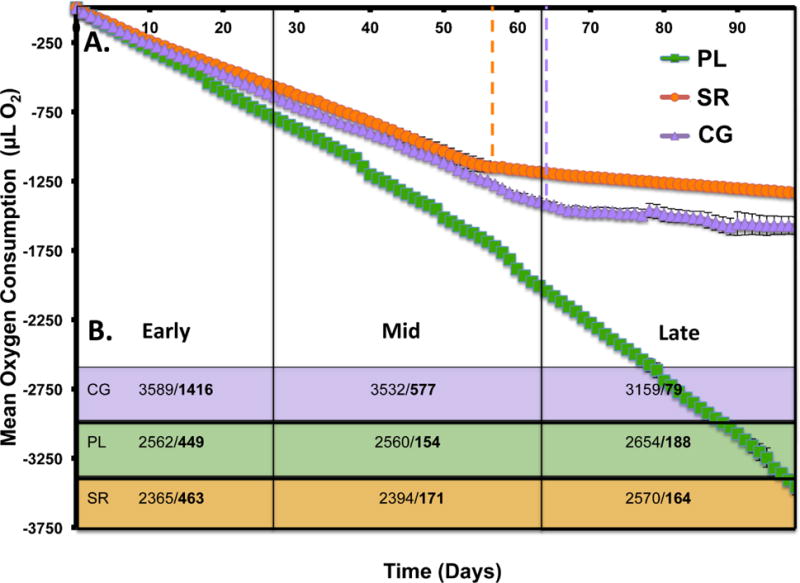
Measures of biological transformation of DOM over time. A) Mean cumulative oxygen consumption (μL O2) by CG3 for Cotton Glacier (CG), Pony Lake (PL), and Suwannee River (SR) under constant incubation conditions, error bars ± 1 SD. O2 measurements were taken every 24 hours for 98 days (N=3). Dashed lines indicate a significant break-point in linearity for CG (day 64) and SR (day 56). B) Number of molecular constituents measured/constituents with significantly changed abundance in bold (adjusted P<0.05) between timepoints (Early=days 0-27, Mid=d27-62, and Late=d62-98) for CG3 incubations with CG, PL and SR DOM sources.
Fluorescent characterization of DOM transformations
CG amended samples showed regions of maximum fluorescence (Excitation [Ex]: 240-280 nm, Emission [Em]: 300-350 nm; SI Fig. 1) corresponding to the proteinaceous fluorophores B and T (Coble 1996; Stedmon et al. 2003). DOM fluorescence was found at longer emission wavelengths (Ex: 240-280nm, Em: 400-450 nm), representing humic-like fluorophores A and C in both PL and SR DOM. Fluorescence intensity values in the proteinaceous regions (B and T fluorophores) were summed and classified as more reactive, while humic-like fluorescence regions (A and C fluorophores) were combined and classified as less-reactive and more recalcitrant. The fluorescence in both regions was summed and converted to the percentage change relative to the previous sampling point (Fig. 2). Throughout the 98-day incubations, dynamic fluctuations were detected by EEMs showing the generation or loss of specific fluorophores. These results were further confirmed (SI Fig. 4) using PARAFAC analysis, a statistical approach that considers individual fluorescing OM regions.
Figure 2.

Change in fluorescent intensity (F.I.; Raman Units, R.U.) for Cotton Glacier (CG), Pony Lake (PL), and Suwannee River (SR) calculated from normalized EEMs for (A) percent more-reactive fraction of DOM fluorescence and B) percent less-reactive fraction of DOM fluorescence, at each sampling point, relative to the total amount of change in reactive fluorescence throughout the duration of the experiment (98 days). Sample intervals (SI) are the difference in F. I. between two sampling points. S.I.1=d2-10, S.I.2=d10-18, S.I.3=d18-26, S.I.4=d26-34, S.I.5=d34-41, S.I.6=41-49, S.I.7=49-55, S.I.8=d55-60, S.I.9-d60-72, S.I.10=d72-78, S.I.11=d78-83, S.I.12=d83-90, S.I.12=d90-97. Experimental phases correspond to exometabolome time ranges, and Early = d0-27, Mid = d28-63, and Late = d64-98.
Analysis of DOM molecular constituent transformations
Liquid chromatography coupled mass spectrometry (UPLC-Q-TOF MS) is a powerful platform for the untargeted relative quantitation of small molecules over time (Want et al. 2005; Smith et al. 2006). While EEMs analysis provided bulk level characterization, UPLC-Q-TOF MS was used to track changes in abundance of individual molecular constituents at four timepoints: days 0, 27, 63, and 98. 5,040 distinct molecular constituents were detected across all carbon sources and timepoints. Pairwise comparisons between timepoints (time ranges: Early= days 0-27; Mid = days 27-63, Late= days 63-98) were used to calculate variances in abundances of constituents over time. While significant (adjusted P< 0.05) changes in abundance occurred throughout the incubations, the number of transformed constituents was highest in the early time range (Fig. 1B). The late time range contained the least transformed constituents for CG and SR, coinciding with decreased respiration rates.
To highlight biologically relevant molecular constituents, a one-way ANOVA was carried out for each carbon source. Overall, 3,057 molecular constituents showing a significant (adjusted P< 0.01) abundance change over time were retained. The unique mass/retention time of each constituent was used to determine similarities between carbon sources (Fig. S2A). Over the course of the experiment, 38% of significantly changed constituents were found in all three carbon sources, while 26% were unique to CG. PL (8%) and SR (5%) had fewer uniquely transformed molecular constituents.
Two-way ANOVAs (timepoint, carbon source) were used to assess how trends in constituent abundance over time compared between carbon sources. Of these, 749 demonstrated a significant change by carbon source (adjusted P<0.01). Cluster analysis demonstrated both source and time dependence of DOM transformation by CG3 (Fig. 3). Only the early time range clustered exclusively by time, indicating that these transformations were more similar across all carbon sources.
Figure 3.

Profile of significant (adjusted P<0.01) molecular constituent abundance changes in CG3-DOM incubations detected by UPLC-Q-TOF MS analysis. A) Heatmap of CG3 molecular constituent abundance fold changes across time range (Early: d0-27, Mid: d28-63, Late: d64-98) and carbon source (Cotton Glacier: CG, Pony Lake: PL, Suwannee River: SR). Abundance increases and decreases are shown in blue and red, respectively. Constituents (columns) that cluster together have similar abundance patterns over time with respect to each carbon source. B) Profile of the UPLC retention time based relative polarity of constituents. The dashed line represents the cutoff used to classify more- (below) and less- (above) reactive constituents.
Retention time and m/z values were used to identify exometabolite molecular constituents. Of 150 commonly identified metabolites, 26 were confirmed across all carbon sources and timepoints. Of those identified, 31% were amino acids, with the remaining being metabolic degradation products.
Characterization of DOM source material intrinsic properties
Intrinsic chemical properties of the DOM source materials were determined to provide comparisons between the DOM sources used to predict processing rates. Datasets of EEMs, FT-ICR MS, and UPLC-Q-TOF MS data were divided into chemical classes consisting of relatively more- or less reactive molecular components. Each of these methods captures a different portion of the DOM pool, providing a more comprehensive analysis. Collectively, the analyses generated the same DOM chemical reactivity continuum with CG>PL>SR (Fig. 4, Fig 5, Table S3). The chemical classifications of CG and SR DOM based on H/C and O/C ratios are provided on van Krevelen diagrams (Kim et al. 2003) in Fig. 5A-B. PL data are shown in D’Andrilli et al., (2013). Molecular formulae common to all carbon sources are present within the lipid-, protein-, carbohydrate-like, and highly unsaturated chemical species including both: phenolic-, and polyphenolic-like regions of the van Krevelen diagram (Fig. 5C). Further information on molecular components of the DOM source materials is presented in the SI and can be found in the Antarctic Master Data repository at https://gcmd.gsfc.nasa.gov/search/Metadata.do?entry=USAP-1141978
Figure 4.

Cotton Glacier (CG), Pony Lake (PL), and Suwannee River (SR) DOM source material characterization detected by A) EEMs, where dashed lines represent the boundary of the more-reactive fluorescence region, fluorescence intensity in Raman Units (R.U) B) FT-ICR MS where the molecular lability boundary is highlighted as a dashed line, with chemically labile constituents having H/C ≥ 1.5, and C) reverse-phase UPLC-Q-TOF MS total ion chromatograms overlaid with the solvent elution profile where the dashed line represents the cutoff utilized for more-(right) and less-(left) reactive classification.
Figure 5.

DOM molecular composition on van Krevelen diagrams for organic matter isolated from A) Cotton Glacier DOM and B) IHSS Suwannee River natural organic matter. Molecular formulae detected in all carbon sources (CG, PL, and SR) are shown in (C) with labeled chemical class regions (modified from Hodgkins et al. (2016)), corresponding to the boundary conditions presented in (D), which shows the chemical class percentages contributing to each carbon source calculated from the molecular formulae.
Discussion
Glaciers, positioned at the top of the cryosphere hydrological cycle, are reservoirs of atmospherically deposited and biologically produced, chemically labile DOM (Stubbins et al. 2012, Smith et al. 2017). Studies linking microbial metabolism to both the ancient (Hood et al. 2009) and newly synthesized (Smith et al. 2017) fractions of DOM exist; however, the molecular mechanisms responsible for the rapid assimilation and transformation of glacial DOM are largely unresolved.
Across natural environments, DOM heterogeneity promotes ecosystem stability by providing diverse compounds as energy sources to heterotrophic bacteria (Wetzel 2003). Ecologically, it remains to be determined which community members, either rare or abundant, have an influential role in DOM processing. It is not known if a single organism is capable of processing compositionally diverse DOM, or if transformations rely on a cascade of events between community members. To understand this complicated network, single organism studies in combination with environmentally isolated DOM sources can help elucidate our understanding of the dynamic nature of DOM processing. Janthinobacterium sp. strain CG3 was selected based on its global ubiquity and genome-enabled predicted metabolic flexibility (see SI). All three DOM sources in the present study supported respiration by CG3, despite their different starting points along the chemical reactivity continuum.
Microbially mediated DOM transformations and loss ultimately dictate the reactivity of DOM across aquatic ecosystems. The spectrum of environmental DOM lability (labile, semi-labile, recalcitrant) has typically been characterized by the extent of microbial interaction over time (Jaio et al. 2010), however, based on the techniques used, incubation times, and analytical limitations it is likely that these classifications are not applicable to all ecosystems and experimental questions. It is therefore more realistic to consider OM reactivity along a continuous spectrum (e.g., Koehler et al. 2012, Mostovaya et al. 2016). For this study, we characterized the chemical character of each carbon source to form hypotheses about processing and then analyzed the data based on a reactivity continuum. We defined the carbon components having the highest degree of change as the most reactive. Due to the highly dynamic fluctuations in amino acid-like fluorescence over time, these constituents were the most reactive across all source materials and time (Fig. 2).
For all carbon sources, exometabolite changes were greatest during the early time range, indicative of the greatest degree of DOM transformation. While the late time range contained the least transformed constituents for CG and SR, coinciding with decreased respiration rates. Results from EEMs/PARAFAC and exometabolite analyses confirmed the importance of amino acids as a dominant fraction of the reactive DOM pool, consistent with the findings of (Cory and Kaplan 2012), while also showing that they experienced the most dynamic range of changes in our system. Interpreting the differences in respiration and exometabolites among carbon sources suggests that reactivity is contextual, being linked to both the microbial response to their energy source and the chemical composition of the DOM itself.
While chemical analyses (i.e. EEMs, FT-ICR MS, and UPLC-Q-TOF MS) identified CG DOM as the most chemically reactive carbon source, CG DOM did not support an initial spike in cellular respiration, rather, the first significant change in the rate of cellular respiration was identified for CG DOM at day 64 (P<0.001). These results are not indicative of a highly reactive source of DOM as suggested by simple sugar studies (Gruber et al. 2006; Hartley et al. 2010; Rousk et al. 2014). However, there were measurable changes in net fluorescence intensity and abundance of exometabolites, representing bacterial interactions with each carbon source. Over time, when combined with extended studies of biological processing, CG DOM did not support greater rates of cellular respiration or carbon turnover compared to other representative end-member more chemically heterogeneous DOM sources (PL and SR). The carbon source with the greatest extent of chemical heterogeneity was PL, which was steadily processed over the course of the experiment (no significant break-point could be identified P>0.076), and also supported the greatest rate of respiration (32.76 μL O2 consumed/day). Thus, our findings are consistent with the idea that while glacial DOM is more compositionally labile than the other two sources, the low degree of chemical heterogeneity may not necessarily support long-term metabolism. Therefore, our data indicate that caution is warranted when extrapolating from short-term studies.
In marine environments the accumulation of recalcitrant carbon has been linked to microorganisms (Ogawa et al. 2001; Jiao et al. 2010), and recent findings suggest that bacteria are responsible for the formation of structurally complex and persistent molecules (Lechtenfeld et al. 2015). Similar trends have not been established for freshwater habitats. Both EEMs and UPLC-Q-TOF MS measurements over 98 days provide evidence for dynamic cycling of DOM. The largest fluorescent changes over time were associated with the proteinaceous region, demonstrating the preferential usage of more reactive compounds. In contrast to previously reported data for marine systems, no overall increase in less-labile fluorescent material was observed over time. Fewer fluctuations in fluorescent DOM were observed for more humic-like compounds over time, indicating that this fraction is still biologically altered, but to a lesser extent.
Microbes have been shown to interact with DOM in a variety of ways, ranging from ignoring, consuming, producing, and fragmenting via extracellular enzymes (Kujawinski 2011). These interactions present a range of potential processing pathways an organism may employ, providing an explanation for the diversity of molecular and fluorescent DOM changes seen throughout this study. DOM transformations can occur very rapidly at the community level, masking carbon cycling intermediates and products generated by organisms. As the importance of metabolic intermediates and the effect on overall DOM processing is poorly understood, it is valuable to study individual organisms in controlled experiments to reduce the effect of confounding ecosystem variables. Studies of this type ultimately lead to greater insight of the contribution of an individual organism’s metabolism to community level DOM processing. The metabolic flexibility of CG3 is key to its ability to survive on a range of carbon substrates. Perhaps organisms in cold temperature environments require extensive flexibility based on the intermittent nature of available energy sources in these extreme environments.
It has been proposed that as glacial carbon enters aquatic ecosystems, microbial metabolism will be stimulated (Hood et al. 2009; Singer et al. 2012). The Cotton Glacier stream is an expansive hydrologic feature (Foreman et al. 2013), where melt-water transported across the glacial surface eventually flushes into the Ross Sea. Discharge of glacial DOM and its biological implications will have heightened ecological relevance as we face a warming climate with increasing glacial loss. This study is the first to propose that although glacially derived DOM is compositionally labile in nature, lability alone may not be the best predictor of downstream ecosystem effects. Rather, lability and compositional heterogeneity combined may more accurately predict the response of microorganisms to the released material and its long-term impacts on downstream ecosystems. These findings argue for a re-evaluation of the biological implications of glacially released carbon on nearby ecosystems. To date, the majority of the glacial OC research conducted has been in Arctic regions, while these areas are undergoing rapid warming leading to increased carbon loss, it is important to recognize that the Antarctic Ice Sheet contains ~93% of glacially stored OC (Hood et al. 2015). Based on the sheer amount of carbon in Antarctic ecosystems more information is needed about the chemical composition and biological response to these sources of glacial OC. This information will enable more accurate predictions about the role of glacial DOM in stimulating microbial metabolism of aquatic environments.
Our ability to capture the dynamic nature of DOM processing was made possible by a combination of methods. In particular, UPLC-Q-TOF MS is well suited for high throughput studies of DOM processing, and can also be used to measure the internal metabolic response of organisms. Internal metabolite response will allow for the reconstruction of the specific pathways involved in the processing of complex and environmentally relevant DOM sources. When evaluating the impact of carbon release from glaciers, it is important to survey not only the quantity, but also the shifts in composition and chemical heterogeneity over time to allow for more accurate predictions about the role of DOM sources in the microbial loop, DOM transport, and ultimately CO2 release to the atmosphere.
Supplementary Material
Scientific Significance Statement.
Glaciers are a significant reservoir of dissolved organic matter (DOM), with the potential to impact global carbon cycling. Current understanding of biological DOM processing is dominated by oceanographic studies, with a significant knowledge gap regarding how individual organisms interact with complex DOM from freshwater sources. We show that although DOM from glaciers is chemically labile, it does not support sustained respiration, thus lability alone is not sufficient to predict downstream effects on carbon cycling.
Acknowledgments
This work was supported by the National Science Foundation Division of Antarctic Sciences through ANT-0838970 and -1141978, by the NSF Division of Graduate Education through DGE-0654336 to CMF, by the NSF Division of Materials Research through DMR 11-57490, the State of Florida, and a NASA Earth and Science Space Fellowship to HJS. We thank Jonathan Hilmer and Daniel Willems, and the Montana State University Proteomics, Metabolomics, and Mass Spectrometry facility which supported in part by funding from the Murdock Charitable Trust and NIGMS NIH P20GM103474 of the IDEA program. Funding from the National Science Foundation (MCB 1413321) helped to develop methods used for metabolite analysis. We acknowledge and thank the CG and PL field teams, in particular Diane McKnight and Y-P. Chin. We thank Peg Dirckx for graphics assistance, and David Podgorski, Brian Ruddy, and the Ion Cyclotron Resonance Facility staff members at the National High Magnetic Field Laboratory. Any opinions, findings, or conclusions expressed in this material are those of the authors and do not necessarily reflect the views of the National Science Foundation.
Footnotes
Author contributions: H.J.S, M.T, B.B, C.M.F designed the research, H.J.S., M.T., J.D performed the research, H.J.S, M.T, J.D, A.P, B.B, C.M.F analyzed the data, H.J.S, M.T, J.D, A.P, B.B, C.M.F wrote the paper.
Data Availability Statement
Data is available in the Antarctic Master Data repository at https://gcmd.gsfc.nasa.gov/search/Metadata.do?entry=USAP-1141978
References
- Antarctic Master Data repository at https://gcmd.gsfc.nasa.gov/search/Metadata.do?entry=USAP-1141978
- Bhatia MP, Das SB, Xu L, Charette MA, Wadham JL, Kujawinski EB. Organic carbon export from the Greenland ice sheet. Geochimica et Cosmochimica Acta. 2013;109:329–344. doi: 10.1016/j.gca.2013.02.006. [DOI] [Google Scholar]
- Coble PG. Characterization of marine and terrestrial DOM in seawater using excitation-emission matrix spectroscopy. Marine chemistry. 1996;51:325–346. doi: 10.1016/0304-4203(95)00062-3. [DOI] [Google Scholar]
- Cole JJ, Prairie YT, Caraco NF, et al. Plumbing the Global Carbon Cycle: Integrating Inland Waters into the Terrestrial Carbon Budget. Ecosystems. 2007;10:172–185. doi: 10.1007/s10021-006-9013-8. [DOI] [Google Scholar]
- Cory RM, Kaplan LA. Biological lability of streamwater fluorescent dissolved organic matter. Limnology Oceanography. 2012;57:1347–1360. doi: 10.4319/lo.2012.57.5.1347. [DOI] [Google Scholar]
- Dittmar T, Koch B, Hertkorn N, Kattner G. A simple and efficient method for the solid-phase extraction of dissolved organic matter (SPE-DOM) from seawater. Limnology and Oceanography-Methods. 2008;6:230–235. [Google Scholar]
- D’Andrilli J, Foreman CM, Marshall AG, McKnight DM. Characterization of IHSS Pony Lake fulvic acid dissolved organic matter by electrospray ionization Fourier transform ion cyclotron resonance mass spectrometry and fluorescence spectroscopy. Organic Geochemistry. 2013;65:19–28. doi: 10.1016/j.orggeochem.2013.09.013. [DOI] [Google Scholar]
- D’Andrilli J, Cooper W, Foreman C, Marshall A. An ultrahigh resolution mass spectrometry index to estimate natural organic matter lability". Rapid Communications in Mass Spectrometry. 2015;29:2385–2401. doi: 10.1002/rcm.7400. [DOI] [PMC free article] [PubMed] [Google Scholar]
- Emmett MR, White FM, Hendrickson CL, Shi S, Marshall AG. Application of micro-electrospray liquid chromatography techniques to FT-ICR MS to enable high-sensitivity biological analysis. Journal of the American Society for Mass Spectrometry. 1998;9:333–340. doi: 10.1016/S1044-0305(97)00287-0. [DOI] [PubMed] [Google Scholar]
- Foreman CM, Cory RM, Morris CE, et al. Microbial growth under humic-free conditions in a supraglacial stream system on the Cotton Glacier, Antarctica. Environmental Research Letters. 2013;8:035022. doi: 10.1088/1748-9326/8/3/035022. [DOI] [Google Scholar]
- Gruber DF, Simjouw JP, Seitzinger SP, Taghon GL. Dynamics and characterization of refractory dissolved organic matter produced by a pure bacterial culture in an experimental predator-prey system. Applied Environmental Microbiology. 2006;72:4184–4191. doi: 10.1128/AEM.02882-05. [DOI] [PMC free article] [PubMed] [Google Scholar]
- Guillemette F, del Giorgio PA. Reconstructing the various facets of dissolved organic carbon bioavailability in freshwater ecosystems. Limnology and Oceanography. 2011;56:734–748. [Google Scholar]
- Hansell DA, Carlson CA. Biogeochemistry of Marine Dissolved Organic Matter. Academic Press; 2014. [Google Scholar]
- Hartley Hopkins, Sommerkorn Wookey. The response of organic matter mineralisation to nutrient and substrate additions in sub-arctic soils. Soil Biology and Biochemistry. 2010;42:9–9. doi: 10.1016/j.soilbio.2009.10.004. [DOI] [Google Scholar]
- Hodgkins SB, et al. Elemental composition and optical properties reveal changes in dissolved organic matter along a permafrost thaw chronosequence in a subarctic peatland. Geochimica et Cosmochimica Acta. 2016;187:123–140. [Google Scholar]
- Hood E, Fellman J, Spencer RGM, Hernes PJ, Edwards R, D’Amore D, Scott D. Glaciers as a source of ancient and labile organic matter to the marine environment. Nature. 2009;462:1044–1047. doi: 10.1038/nature08580. [DOI] [PubMed] [Google Scholar]
- Hood E, Battin TJ, Fellman J, O’Neel S, Spencer RGM. Storage and release of organic carbon from glaciers and ice sheets. Nature Geoscience. 2015;8:91–96. doi: 10.1038/ngeo2331. [DOI] [Google Scholar]
- Jiao N, Herndl GJ, Hansell DA, et al. Microbial production of recalcitrant dissolved organic matter: long-term carbon storage in the global ocean. Nature Reviews Microbiology. 2010;8:593–599. doi: 10.1038/nrmicro2386. [DOI] [PubMed] [Google Scholar]
- Jiao N, Azam F, Sanders S, editors. Microbial Carbon Pump in the Ocean. American Association for the Advancement of Science; 2013. [Google Scholar]
- Jørgensen L, Lechtenfeld O, Benner R, Middelboe M, Stedmon CA. Bacterial production and transformation of dissolved neutral sugars and amino acids in seawater. Biogeosciences Discussions. 2014;11:6151–6184. doi: 10.5194/bgd-11-6151-2014. [DOI] [Google Scholar]
- Kim S, Kramer RW, Hatcher PG. Graphical method for analysis of ultrahigh-resolution broadband mass spectra of natural organic matter, the van Krevelen diagram. Analytical Chemistry. 2003;75:5336–5344. doi: 10.1021/ac034415p. [DOI] [PubMed] [Google Scholar]
- Koehler B, Wachenfeldt E, Kothawala D, Tranvik LJ. Reactivity continuum of dissolved organic carbon decomposition in lake water. Journal of Geophysical Research: Biogeosciences. 2012:117. doi: 10.1029/2011JG001793. [DOI] [Google Scholar]
- Kujawinski EB. The Impact of Microbial Metabolism on Marine Dissolved Organic Matter. Annual Review of Marine Science. 2011;3:567–599. doi: 10.1146/annurev-marine-120308-081003. [DOI] [PubMed] [Google Scholar]
- Lawson EC, Wadham JL, Tranter M, Stibal M, Lis GP, Butler CEH, Laybourn-Parry J, Nienow P, Chandler D, Dewsbury P. Greenland Ice Sheet exports labile organic carbon to the Arctic oceans. Biogeosciences. 2014;10:19311–19345. [Google Scholar]
- Lechtenfeld OJ, Hertkorn N, Shen Y, Witt M, Benner R. Marine sequestration of carbon in bacterial metabolites. Nature Communications. 2015;6:6711. doi: 10.1038/ncomms7711. [DOI] [PubMed] [Google Scholar]
- Mopper K, Stubbins A, Ritchie JD, Bialk HM, Hatcher PG. Advanced instrumental approaches for characterization of marine dissolved organic matter: extraction techniques, mass spectrometry, and nuclear magnetic resonance spectroscopy. Chemical Reviews. 2007;107:419–442. doi: 10.1021/cr050359b. [DOI] [PubMed] [Google Scholar]
- Mou X, Sun S, Edwards RA, Hodson RE, Moran MA. Bacterial carbon processing by generalist species in the coastal ocean. Nature. 2008;451:708–711. doi: 10.1038/nature06513. [DOI] [PubMed] [Google Scholar]
- Mostovaya A, Koehler B, Guillemette F, Brunberg AK, Tranvik LJ. Effects of compositional changes on reactivity continuum and decomposition kinetics of lake dissolved organic matter. Journal of Geophysical Research: Biogeosciences. 2016;121:1733–1746. doi: 10.1002/2016JG003359. [DOI] [Google Scholar]
- Nelson CE, Carlson CA. Tracking differential incorporation of dissolved organic carbon types among diverse lineages of Sargasso Sea bacterioplankton. Environ Microbiol. 2012;14:1500–1516. doi: 10.1111/j.1462-2920.2012.02738.x. [DOI] [PubMed] [Google Scholar]
- Nikrad MP, Cottrell MT, Kirchman DL. Abundance and single-cell activity of heterotrophic bacterial groups in the western Arctic Ocean in summer and winter. Applied and Environmental Microbiology. 2012;78:2402–2409. doi: 10.1128/AEM.07130-11. [DOI] [PMC free article] [PubMed] [Google Scholar]
- Ogawa H, Amagai Y, Koike I, Kaiser K, Benner R. Production of refractory dissolved organic matter by bacteria. Science. 2001;292:917–920. doi: 10.1126/science.1057627. [DOI] [PubMed] [Google Scholar]
- Pedler BE, Aluwihare LI, Azam F. Single bacterial strain capable of significant contribution to carbon cycling in the surface ocean. Proceedings of the National Academy of Sciences. 2014;111:7202–7207. doi: 10.1073/pnas.1401887111. [DOI] [PMC free article] [PubMed] [Google Scholar]
- Rousk J, Hill PW, Jones DL. Using the concentration-dependence of respiration arising from glucose addition to estimate in situ concentrations of labile carbon in grassland soil. Soil Biology and Biochemistry. 2014;77:81–88. doi: 10.1016/j.soilbio.2014.06.015. [DOI] [Google Scholar]
- Singer GA, Fasching C, Wilhelm L, Niggemann J, Steier P, Dittmar T, Battin TJ. Biogeochemically diverse organic matter in Alpine glaciers and its downstream fate. Nature Geoscience. 2012;5:710–714. doi: 10.1038/ngeo1581. [DOI] [Google Scholar]
- Smith CA, Want EJ, O’Maille G, Abagyan R, Siuzdak G. XCMS: processing mass spectrometry data for metabolite profiling using nonlinear peak alignment, matching, and identification. Analytical Chemistry. 2006;78:779–787. doi: 10.1021/ac051437y. [DOI] [PubMed] [Google Scholar]
- Smith HJ, Foster RA, McKnight DM, Lisle JT, Littmann S, Kuypers MMM, Foreman CM. Microbial formation of labile organic carbon in Antarctic glacial environments. Nature Geoscience. 2017;10:356–359. doi: 10.1038/ngeo2925. [DOI] [Google Scholar]
- Smith H, Akiyama T, Foreman C, et al. Draft Genome Sequence and Description of Janthinobacterium sp. Strain CG3, a Psychrotolerant Antarctic Supraglacial Stream Bacterium Genome Announcements 1. 2013 doi: 10.1128/genomeA.00960-13. [DOI] [PMC free article] [PubMed] [Google Scholar]
- Stedmon CA, Markager S, Bro R. Tracing dissolved organic matter in aquatic environments using a new approach to fluorescence spectroscopy. Marine Chemistry. 2003;82:239–254. doi: 10.1016/S0304-4203(03)00072-0. [DOI] [Google Scholar]
- Stedmon CA, Bro R. Characterizing dissolved organic matter fluorescence with parallel factor analysis: a tutorial. Limnology and Oceanography Methods. 2008:572–579. [Google Scholar]
- Vahatalo AV, Aarnos H, Mantyniemi S. Biodegradability continuum and biodegradation kinetics of natural organic matter described by the beta distribution. Biogeochemistry. 2010;100:227–240. doi: 10.1007/s10533-010-9419-4. [DOI] [Google Scholar]
- Want EJ, Cravatt BF, Siuzdak G. The expanding role of mass spectrometry in metabolite profiling and characterization. Chembiochem. 2005;6:1941–1951. doi: 10.1002/cbic.200500151. [DOI] [PubMed] [Google Scholar]
- Wetzel R. Dissolved organic carbon: Detrital energetics, metabolic regulators, and drivers of ecosystem stability of aquatic ecosystems, p. In: Findlay S, Sinsabaugh RL, editors. Aquatic ecosystems: Interactivity of dissolved organic matter. Elsevier Science; 2003. pp. 455–477. [Google Scholar]
Associated Data
This section collects any data citations, data availability statements, or supplementary materials included in this article.