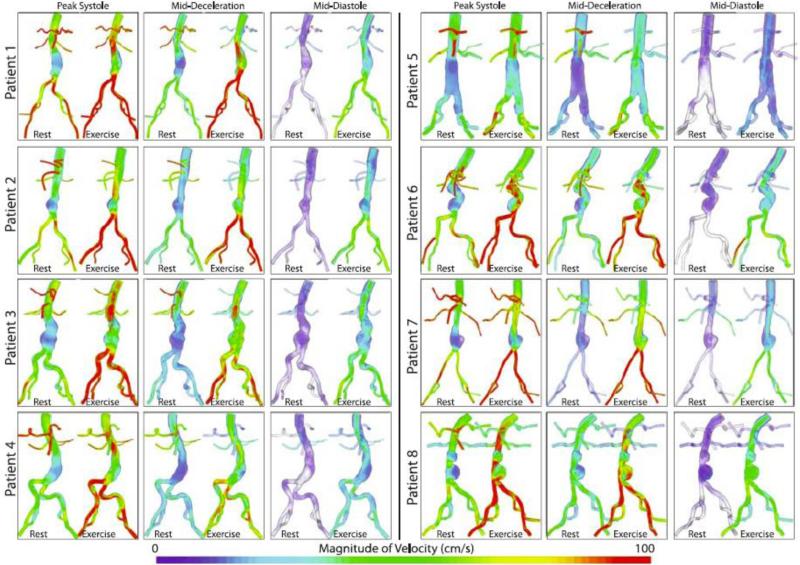
Figure 6.
The magnitude of the ensemble average of the velocity field at three points in the cardiac cycle (peak systole, mid-deceleration, and mid-diastole) is plotted using a volume rendering technique for all patients for both rest and exercise. In general, the flow features look more complex during exercise than during rest, for all three reported time points. In particular, during exercise, features such as jets and recirculation zones can be observed, especially during diastole and mid-deceleration.

