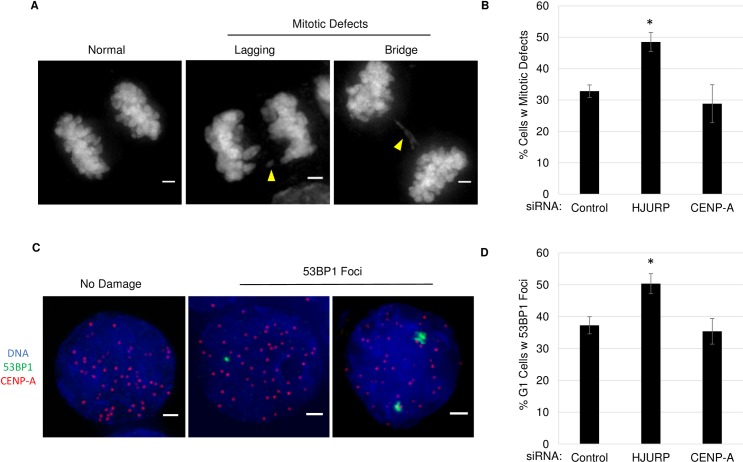
Fig 5. Increased ectopic CENP-A can lead to mitotic defects and DNA damage.
A.) DAPI labeled DNA showing anaphase cells. Scale bar 1 μm. B.) Graph quantifying the number of cells with mitotic defects after siRNA. Error indicates SEM from 3 experiments n>65 cells per treatment. (*indicates P-value <0.01, Students t-test). C.) IF image showing G1 phase representative SW480 cells with or without DNA damage. IF for 53BP1, CENP-A and DAPI. Scale bar indicates 1 μm D.) Graph quantifying the percent of G1 phase cells with 53BP1 foci after siRNA. Error indicates SEM from 3 experiments n>250 per condition. (*indicates P-value <0.05, Students t-test).

