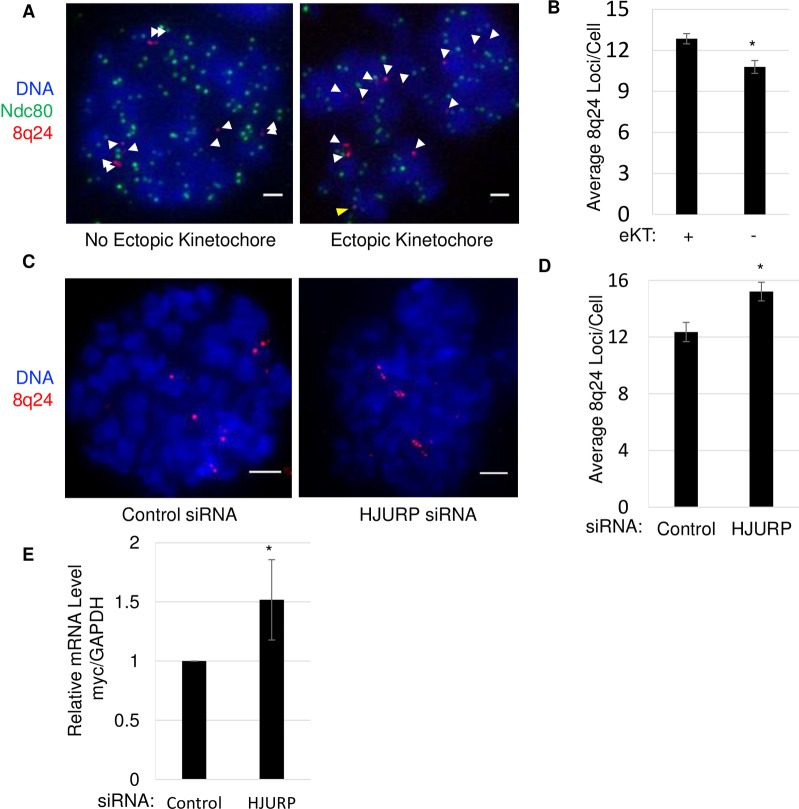
Fig 6. Ectopic kinetochore formation correlates with amplification of the 8q24/MYC locus and increased MYC expression.
A.) Images showing IF in mitotic SW480 cells for Ndc80 and FISH for 8q24 locus. Scale bar indicates 1 μm. White arrows indicate FISH signals. Yellow arrowheads indicate colocalization. B.) Graph quantifying the number of 8q24 loci per cell for both ectopic kinetochore positive and negative cells, indicated by Ndc80 colocalization with at least one 8q24 FISH site. Error indicates SEM from 4 experiments n>200. (*indicates P-value <0.01, Students t-test). C.) Images showing DAPI stained DNA and FISH for the 8q24 locus in either control or HJURP knockdown cells. D.) Graph quantifying the number of 8q24 loci per cell for both control and HJURP knockdown cells. Error indicates SEM from 3 experiments n>190. (*indicates P-value <0.01, Students t-test). E.) Graph showing results of qPCR from mRNA harvested from either control or HJURP knockdown cells. Error measured from 3 experiments.

