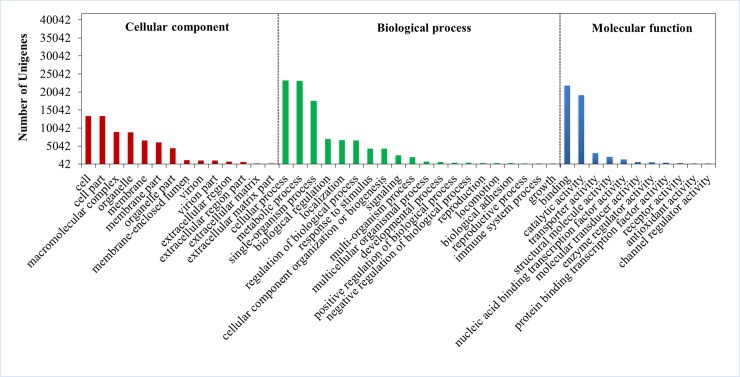
Fig 2. GO classification of unigenes in the categories of Biological Process, Cellular Component, and Molecular Function.
The left y-axis shows the number of unigenes annotated in each subcategory. The abscissa axis represents the subterms of Biological Process, Cellular Component, and Molecular Function, three different GO categories.

